IST

  • Market Cap: Micro Cap
  • Industry: Auto Components & Equipments
  • ISIN: INE684B01029
  • NSEID: ISTLTD
  • BSEID: 508807
INR
646.15
0.00 (0.00%)
BSENSE

Sep 01, 03:30 PM

BSE+NSE Vol: 681

  • Price Points
  • Score
  • Mojo Parameters
  • Total Return
  • News and Corporate Actions
  • Key factors
  • Shareholding
  • Financials
  • CompanyCV
stock-summaryPrice Point
High/Low

1Day

52 Week

Valuation
Technical
Day's Volume

CASH

681 (199.74%) Volume

Shareholding (Jun 2026)

FII

0.00%

Held by 0 FIIs

DII

1.11%

Held by 0 DIIs

Promoter

74.98%

Why is IST Ltd falling/rising?

02-Sep-2026

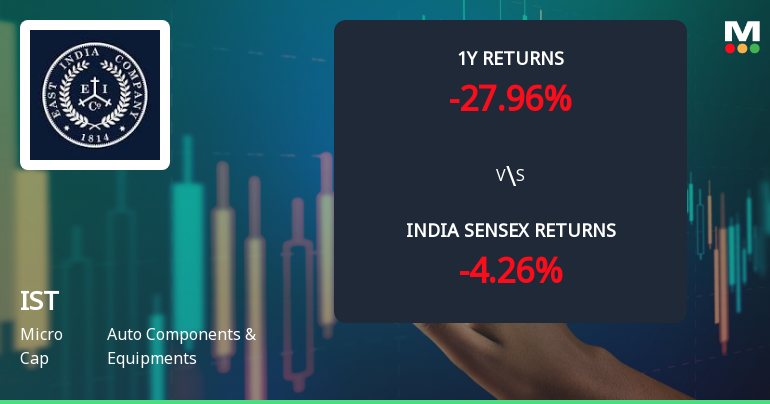
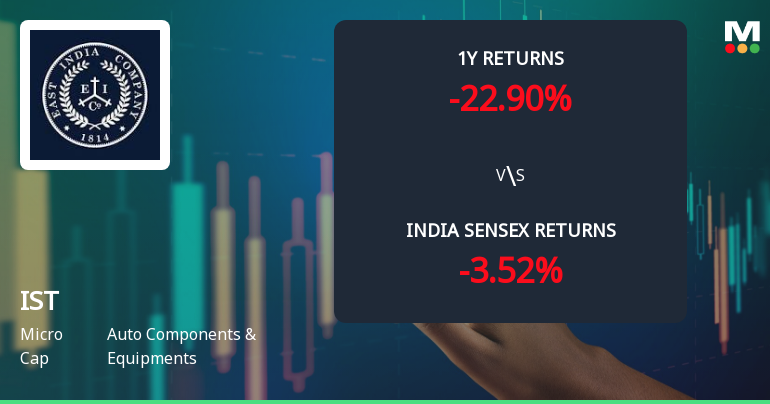
As of 01-Sep, IST Ltd's stock price is falling, currently at 637.70, reflecting a decline of 12.3 or 1.89%. The stock has significantly underperformed over the past year, with a return of -27.96%, and shows troubling trends in sales and profitability, contributing to its ongoing decline.

As of 01-Sep, IST Ltd's stock price is falling, currently at 637.70, which reflects a decrease of 12.3 or 1.89%. The stock has underperformed its sector by 1.6% today and has experienced a consecutive decline over the last two days, resulting in a total drop of 4.82% during this period. Additionally, the stock reached an intraday low of Rs 606.95, marking a significant decline of 6.62%.<BR><BR>The broader performance metrics indicate a troubling trend for IST Ltd. Over the past year, the stock has generated a return of -27.96%, significantly underperforming the benchmark Sensex, which only declined by 4.26% in the same timeframe. The company's long-term growth prospects appear bleak, with net sales decreasing at an annual rate of -1.08% and operating profit declining by -8.79% over the last five years. Furthermore, the company's management efficiency is low, as evidenced by a return on equity (ROE) of only 8.98%, suggesting poor profitability relative to shareholders' funds.<BR><BR>Despite being net-debt free, the company has shown flat results in its latest quarterly report, with a profit before tax (PBT) falling by -25.6% compared to the previous four-quarter average. The stock is also trading below its moving averages across various time frames, indicating a bearish trend. The lack of interest from domestic mutual funds, which hold 0% of the company, may reflect a lack of confidence in its valuation or business prospects.<BR><BR>Overall, the combination of poor financial performance, declining sales and profits, and consistent underperformance against benchmarks contributes to the ongoing decline in IST Ltd's stock price.

View full answer

Who are in the management team of IST?

01-Sep-2026

The management team of IST includes D Keelor (Chairman), Mayur Gupta, Suresh Chand Jain (Whole-time Director), Gaurav Guptaa, Subhash Chander Jain, Manu Aggarwal, Satchit Kumar Basu (Technical Director), Bhupinder Kumar (Company Secretary), and Gurpreet Kaur (Independent Director). For more details on specific members, please ask!

The management team of IST includes the following members:<BR><BR>1. D Keelor - Chairman & Independent Director<BR>2. Mayur Gupta - Non-Executive Director<BR>3. Suresh Chand Jain - Whole-time Director<BR>4. Gaurav Guptaa - Non-Executive Director<BR>5. Subhash Chander Jain - Non-Executive & Independent Director<BR>6. Manu Aggarwal - Independent Director<BR>7. Satchit Kumar Basu - Director (Technical)<BR>8. Bhupinder Kumar - Company Secretary & Compliance Officer<BR>9. Gurpreet Kaur - Independent Director<BR><BR>If you need more details about any specific member or their roles, feel free to ask!

View full answer

What does IST do?

01-Sep-2026

IST Ltd is an Indian micro-cap company that manufactures precision components for various industries, with recent quarterly net sales of 35 Cr and a net profit of 83 Cr. Key financial metrics include a P/E ratio of 5.00 and a market cap of INR 770 Cr.

Overview:<BR>IST Ltd is an Indian company engaged in the manufacture of precision turned, milled, drilled components and stampings for various industries, including auto components, white goods, consumer goods, and dental and orthopedic implants, operating in the micro-cap market.<BR><BR>History:<BR>IST Ltd was incorporated in August 1975. The latest quarterly results reported net sales and net profit for the period ending June 2026.<BR><BR>Financial Snapshot:<BR>Net Sales: 35 Cr (Quarterly Results - Jun 2026) <BR>Net Profit: 83 Cr (Quarterly Results - Jun 2026) <BR>Market-cap: INR 770 Cr (Micro Cap)<BR><BR>Key Metrics:<BR>P/E: 5.00 <BR>Industry P/E: 41 <BR>Dividend Yield: 0.00% <BR>Debt-Equity: -0.05 <BR>Return on Equity: 9.07% <BR>Price to Book: 0.46 <BR><BR>Contact Details:<BR>Address: Delhi-Jaipur Highway No 8, Village Kapriwas Dharuhera Rewari Haryana : 123106 <BR>Tel: 91-01274-267346-48 <BR>Email: istgroup.ho@gmail.com <BR>Website: http://www.istindia.com

View full answer

Who are the peers of the IST?

01-Sep-2026

IST's peers include Pradeep Metals, Veljan Denison, Sterling Tools, Automotive Stamp, Enkei Wheels, Kinetic Engg., Z F Steering, Hind.Composites, CLN Energy, and GKW. Management risk varies from excellent to below average, with growth ratings generally below average for IST and peers, while capital structure is mostly excellent among top peers.

Peers: The peers of IST are Pradeep Metals, Veljan Denison, Sterling Tools, Automotive Stamp, Enkei Wheels, Kinetic Engg., Z F Steering, Hind.Composites, CLN Energy, and GKW.<BR><BR>Quality Snapshot: Excellent management risk is observed at Veljan Denison, Sterling Tools, CLN Energy, and the rest have Average management risk, which includes Pradeep Metals, Automotive Stamp, Hind.Composites, and Kinetic Engg. Below Average management risk is found at IST, Enkei Wheels, Z F Steering, and GKW. Growth ratings show that Excellent growth is seen at Enkei Wheels and CLN Energy, while Good growth is observed at Automotive Stamp, and the rest, including IST, Pradeep Metals, Veljan Denison, Sterling Tools, Kinetic Engg., Z F Steering, and Hind.Composites, have Below Average growth. Capital Structure is Excellent for Veljan Denison, Sterling Tools, IST, Z F Steering, Hind.Composites, and CLN Energy, while Average is found at Pradeep Metals, and the rest, including Automotive Stamp, Enkei Wheels, Kinetic Engg., and GKW, have Below Average capital structure.<BR><BR>Return Snapshot: The peer with the highest 1-year return is Pradeep Metals at 107.08%, while the lowest is Sterling Tools at -27.64%, with IST's own 1-year return at -25.97%, indicating it is slightly better than Sterling Tools. Additionally, peers with negative six-month returns include Sterling Tools, Enkei Wheels, Kinetic Engg., Z F Steering, and Hind.Composites.

View full answer

How big is IST?

01-Sep-2026

As of 31st August, IST Ltd has a market capitalization of 770.00 Cr, with recent Net Sales of 131.66 Cr and a Net Profit of 164.26 Cr. Shareholder's Funds are 1,473.22 Cr and Total Assets are 1,560.88 Cr as of March 2025.

As of 31st August, IST Ltd has a market capitalization of 770.00 Cr, categorizing it as a Micro Cap company.<BR><BR>In the latest four quarters, IST Ltd reported Net Sales of 131.66 Cr and a Net Profit of 164.26 Cr.<BR><BR>The latest annual period for the balance sheet is March 2025, with Shareholder's Funds amounting to 1,473.22 Cr and Total Assets valued at 1,560.88 Cr.

View full answer

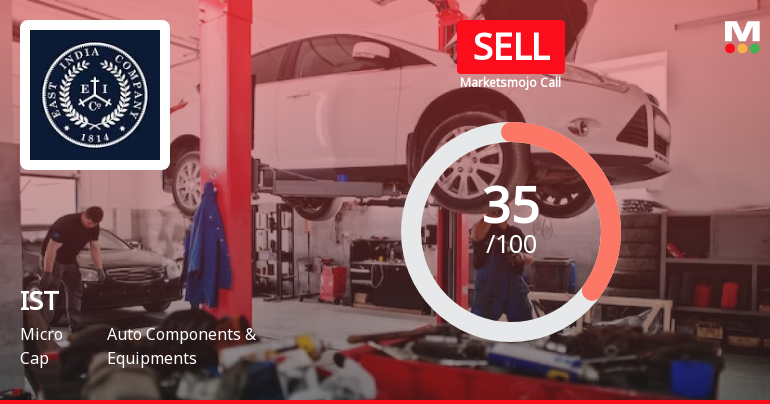
Should I buy, sell or hold IST Ltd?

16-Aug-2026

When is the next results date for IST Ltd?

10-Aug-2026

The next results date for IST Ltd is 14 August 2026.

The next results date for IST Ltd is scheduled for 14 August 2026.

View full answer

Are IST Ltd latest results good or bad?

30-May-2026

IST Ltd's latest Q4 FY26 results are concerning, showing a net loss of ₹9.50 crores and a significant decline in operating margins, despite a 21.97% increase in net sales. Overall, the results are considered bad due to the quarterly loss and margin compression, overshadowing the positive sales growth.

IST Ltd's latest results for Q4 FY26 indicate a challenging situation for the company. The net profit for the quarter was a loss of ₹9.50 crores, which represents a significant decline of 156.65% year-on-year and a 115.32% decrease from the previous quarter. This loss reverses the profitability trend seen in earlier quarters and raises concerns about the sustainability of earnings.<BR><BR>On a more positive note, net sales for Q4 FY26 reached ₹34.42 crores, marking a 21.97% increase year-on-year and a 2.26% increase quarter-on-quarter, which is the highest quarterly revenue recorded. However, the operating margin, excluding other income, has sharply contracted to 38.29% from 70.27% in the same quarter last year, indicating significant operational challenges.<BR><BR>While the full-year performance shows a consolidated net sales increase of 5.50% and a profit after tax growth of 11.20%, the recent quarterly loss and margin compression are critical red flags. The company's reliance on volatile other income, which swung dramatically in Q4, further complicates the outlook.<BR><BR>Overall, the latest results can be characterized as bad, primarily due to the quarterly loss and declining margins, overshadowing the otherwise positive sales growth. Investors should be cautious and closely monitor the company's performance in the upcoming quarters.

View full answer

Is IST technically bullish or bearish?

02-Dec-2025

As of December 1, 2025, the technical trend for IST has shifted to a moderate bearish stance, supported by bearish signals from the MACD, KST, and moving averages, along with a mildly bearish outlook from Bollinger Bands.

As of 1 December 2025, the technical trend has changed from mildly bearish to bearish. The current stance is bearish with a moderate strength. Key indicators driving this assessment include the weekly MACD and KST both showing bearish signals, along with daily moving averages indicating a bearish trend. The Bollinger Bands also reflect a mildly bearish outlook on both weekly and monthly time frames. The lack of significant signals from the RSI further supports the bearish sentiment, while Dow Theory indicates no clear trend. Overall, the technical indicators suggest a negative outlook for IST in the near term.

View full answer

How has been the historical performance of IST?

13-Nov-2025

IST's historical performance shows fluctuating net sales, peaking at 115.03 Cr in Mar'25, with operating profit rising to 189.01 Cr and profit after tax increasing to 139.60 Cr, indicating improved profitability and operational efficiency. Total assets and liabilities reached 1,560.88 Cr, while cash flow from operations rebounded to 41.00 Cr, reflecting a recovery in cash generation.

Answer:<BR>The historical performance of IST shows a fluctuating trend in net sales and profits over the years, with net sales reaching 115.03 Cr in Mar'25, a slight increase from 109.66 Cr in Mar'24, but a decrease from 121.07 Cr in Mar'23. The total operating income followed a similar pattern, ending at 115.03 Cr in Mar'25. The operating profit (PBDIT) for Mar'25 was reported at 189.01 Cr, up from 177.52 Cr in Mar'24, indicating a strong recovery from the previous year's low of 115.82 Cr. Profit before tax also increased to 177.31 Cr in Mar'25 from 168.97 Cr in Mar'24, while profit after tax rose to 139.60 Cr from 125.60 Cr in the same period. The earnings per share (EPS) improved to 119.6 in Mar'25 from 107.71 in Mar'24, reflecting a positive trend in profitability. On the balance sheet, total assets increased to 1,560.88 Cr in Mar'25 from 1,385.45 Cr in Mar'24, with total liabilities also rising to 1,560.88 Cr. The company maintained a strong reserve position, growing to 1,467.38 Cr in Mar'25 from 1,306.56 Cr in Mar'24. Cash flow from operating activities showed a significant recovery to 41.00 Cr in Mar'25, compared to a negative cash flow of -1.00 Cr in Mar'24.<BR><BR>Breakdown:<BR>IST's financial performance over the years has been characterized by fluctuations in net sales, which peaked at 136.52 Cr in Mar'21 before declining to 115.03 Cr in Mar'25. The operating profit (PBDIT) has shown resilience, increasing to 189.01 Cr in Mar'25, indicating effective cost management despite earlier dips. Profit before tax also demonstrated growth, reaching 177.31 Cr in Mar'25, while profit after tax rose to 139.60 Cr, reflecting improved operational efficiency. The company's total assets and liabilities both increased to 1,560.88 Cr in Mar'25, highlighting a stable financial position. Reserves have consistently grown, indicating a solid foundation for future investments. Cash flow from operating activities rebounded to 41.00 Cr in Mar'25, showcasing a recovery in cash generation capabilities after a challenging previous year. Overall, IST's financial metrics suggest a company that is navigating challenges while positioning itself for future growth.

View full answer

Is IST overvalued or undervalued?

09-Jun-2025

As of June 27, 2022, IST is considered very expensive and overvalued with a PE ratio of 7.12, significantly higher than peers like Samvardh and Bosch, and has underperformed the Sensex with a year-to-date return of -9.53%.

As of 27 June 2022, the valuation grade for IST has moved from expensive to very expensive, indicating a significant shift in its market perception. The company appears to be overvalued at this time. Key ratios include a PE ratio of 7.12, an EV to EBITDA of 11.56, and a PEG ratio of 0.65, which suggest that while the earnings are relatively low compared to the price, the growth expectations are also modest.<BR><BR>In comparison to its peers, IST's valuation stands out as notably high, especially when contrasted with Samvardh. Mothe. which is rated attractive with a PE of 29.14, and Bosch, which is classified as expensive with a PE of 46.21. This disparity highlights IST's overvaluation in the context of its industry. Additionally, while IST has shown strong returns over the long term, its recent performance has lagged behind the Sensex, with a year-to-date return of -9.53% compared to the Sensex's 5.66%.

View full answer

Who are the top shareholders of the IST?

06-Jun-2025

The top shareholder of IST is Gupta International Investment Co. Limited, holding 49.95%. Other notable shareholders include Saubhagya Realty And Trade LLP with 4.95% and individual investors with a combined 12.91%.

The top shareholders of IST are primarily the promoters, with Gupta International Investment Co. Limited holding the largest stake at 49.95%. There are no pledged promoter holdings, and mutual funds and foreign institutional investors do not hold any shares in the company. The highest public shareholder is Saubhagya Realty And Trade LLP, which owns 4.95%. Additionally, individual investors collectively hold 12.91% of the shares.

View full answer

Has IST declared dividend?

06-Jun-2025

No Dividend History Available

iScoreScore
Click here to find our call on this stock
Strong Sell
Sell
Hold
Buy
Strong Buy

Dashboard

1

Poor Management Efficiency with a low ROE of 8.98%

  • The company has been able to generate a Return on Equity (avg) of 8.98% signifying low profitability per unit of shareholders funds
2

Poor long term growth as Net Sales has grown by an annual rate of -1.08% and Operating profit at -8.79% over the last 5 years

 
3

Flat results in Jun 26

4

With ROE of 9.1, it has a Very Expensive valuation with a 0.4 Price to Book Value

stock-summaryMojo Parameters

Mojo Parameters

Loading Valuation Snapshot...

Stock DNA

stock-summary
Industry

Auto Components & Equipments

stock-summary
Market cap

INR Cr (Micro Cap)

stock-summary
P/E

5.00

stock-summary
Industry P/E

NA

stock-summary
Dividend Yield

0.00%

stock-summary
Debt Equity

0.00

stock-summary
Return on Equity

0.00%

stock-summary
Price to Book

0.00

Revenue and Profits:
Net Sales:
35 Cr
(Quarterly Results - Jun 2026)
Net Profit:
83 Cr
stock-summaryTotal Returns
Total Returns (Price + Dividend) stock-summary
Icon
Company does not have enough history
Risk Adjusted Returns v/s stock-summary
Returns Beta
Icon
Beta has not been calculated since enough price history is not available
stock-summaryNews & Corporate Actions

Announcements stock-summary

Icon
No announcement available

Corporate Actions stock-summary

stock-summary
BOARD MEETING

No Upcoming Board Meetings

stock-summary
DIVIDEND

No Dividend history available

stock-summary
SPLITS

IST Ltd has announced 5:10 stock split, ex-date: 01 Nov 19

stock-summary
BONUS

No Bonus history available

stock-summary
RIGHTS

No Rights history available

stock-summaryKey Factors

Quality key factors stock-summary

Factor
Value
Sales Growth (5y)
-1.08%
EBIT Growth (5y)
-8.79%
EBIT to Interest (avg)
15.68
Debt to EBITDA (avg)
Net Debt is too low
Net Debt to Equity (avg)
-0.05
Sales to Capital Employed (avg)
0.10
Tax Ratio
20.69%
Dividend Payout Ratio
0
Pledged Shares
0
Institutional Holding
1.11%
ROCE (avg)
6.68%
ROE (avg)
8.98%

Valuation key factors

Factor
Value
P/E Ratio
5
Industry P/E
24
Price to Book Value
0.44
EV to EBIT
10.39
EV to EBITDA
9.50
EV to Capital Employed
0.41
EV to Sales
5.00
PEG Ratio
1.53
Dividend Yield
NA
ROCE (Latest)
4.29%
ROE (Latest)
9.07%

Technicals key factors

Indicator
Weekly
Monthly
MACD
Mildly Bullish
Bearish
RSI
No Signal
No Signal
Bollinger Bands
Bearish
Bearish
Moving Averages
Bearish (Daily)
KST
Bearish
Bearish
Dow Theory
Mildly Bearish
Mildly Bullish
OBV
No Trend
No Trend
stock-summary Technical Indicator Scale: Bearish, Mildly Bearish, Sideways, Mildly Bullish, Bullish  Turned 
stock-summaryShareholding
Shareholding Snapshot : Jun 2026stock-summary
Shareholding Compare (%holding) stock-summary
Majority shareholders

Promoters

Pledged Promoter Holdings

None

Mutual Funds

Held by 0 Schemes

FIIs

Held by 0 FIIs

Promoter with highest holding

Gupta International Investment Co. Limited (49.95%)

Highest Public shareholder

Ist Limited-suspense Escrow Demat Account And Ist Limited Unclaimed Suspense Account (6.52%)

Individual Investors Holdings

12.77%

stock-summaryFinancial
[
  {
    "link": "quarterly",
    "btn_text": "All Quarterly Results",
    "header": "Quarterly Results Snapshot (Consolidated) - Jun'26 - QoQ",
    "rhs": [
      {
        "prefix": "Net Sales ",
        "suffix": "QoQ Growth in quarter ended Jun 2026 is 1.37% vs 2.26% in Mar 2026",
        "dir": -1
      },
      {
        "prefix": "Consolidated Net Profit ",
        "suffix": "QoQ Growth in quarter ended Jun 2026 is 974.84% vs -115.32% in Mar 2026",
        "dir": 1
      }
    ],
    "table": {
      "header": [
        "Jun'26",
        "Mar'26",
        "Change(%)"
      ],
      "body": [
        {
          "field": "Net Sales",
          "val1": "34.89",
          "val2": "34.42",
          "chgp": "1.37%",
          "chgp_class": "positive"
        },
        {
          "field": "Operating Profit (PBDIT) excl Other Income",
          "val1": "15.88",
          "val2": "13.18",
          "chgp": "20.49%",
          "chgp_class": "positive"
        },
        {
          "field": "Interest",
          "val1": "2.10",
          "val2": "0.73",
          "chgp": "187.67%",
          "chgp_class": "negative"
        },
        {
          "field": "Exceptional Items",
          "val1": "0.00",
          "val2": "0.00",
          "chgp": "",
          "chgp_class": "neutral"
        },
        {
          "field": "Consolidate Net Profit",
          "val1": "83.11",
          "val2": "-9.50",
          "chgp": "974.84%",
          "chgp_class": "positive"
        },
        {
          "field": "Operating Profit Margin (Excl OI)",
          "val1": "45.51%",
          "val2": "38.29%",
          "chgp": "7.22%",
          "chgp_class": "positive"
        }
      ]
    }
  },
  {
    "link": "half-yearly",
    "btn_text": "All Half Yearly Results",
    "header": "Half Yearly Results Snapshot (Consolidated) - Sep'25",
    "rhs": [
      {
        "prefix": "Net Sales ",
        "suffix": " Growth in half year ended Sep 2025 is -2.32% vs 13.13% in Sep 2024",
        "dir": -1
      },
      {
        "prefix": "Consolidated Net Profit ",
        "suffix": " Growth in half year ended Sep 2025 is 1.11% vs 44.43% in Sep 2024",
        "dir": -1
      }
    ],
    "table": {
      "header": [
        "Sep'25",
        "Sep'24",
        "Change(%)"
      ],
      "body": [
        {
          "field": "Net Sales",
          "val1": "58.08",
          "val2": "59.46",
          "chgp": "-2.32%",
          "chgp_class": "negative"
        },
        {
          "field": "Operating Profit (PBDIT) excl Other Income",
          "val1": "41.44",
          "val2": "42.06",
          "chgp": "-1.47%",
          "chgp_class": "negative"
        },
        {
          "field": "Interest",
          "val1": "1.49",
          "val2": "3.33",
          "chgp": "-55.26%",
          "chgp_class": "positive"
        },
        {
          "field": "Exceptional Items",
          "val1": "0.00",
          "val2": "0.00",
          "chgp": "",
          "chgp_class": "neutral"
        },
        {
          "field": "Consolidate Net Profit",
          "val1": "100.97",
          "val2": "99.86",
          "chgp": "1.11%",
          "chgp_class": "positive"
        },
        {
          "field": "Operating Profit Margin (Excl OI)",
          "val1": "71.35%",
          "val2": "70.74%",
          "chgp": "0.61%",
          "chgp_class": "positive"
        }
      ]
    }
  },
  {
    "link": "nine-monthly",
    "btn_text": "All Nine Monthly Results",
    "header": "Nine Monthly Results Snapshot (Consolidated) - Dec'25",
    "rhs": [
      {
        "prefix": "Net Sales ",
        "suffix": "YoY Growth in nine months ended Dec 2025 is 5.68% vs 7.57% in Dec 2024",
        "dir": -1
      },
      {
        "prefix": "Consolidated Net Profit ",
        "suffix": "YoY Growth in nine months ended Dec 2025 is 32.34% vs 21.46% in Dec 2024",
        "dir": 1
      }
    ],
    "table": {
      "header": [
        "Dec'25",
        "Dec'24",
        "Change(%)"
      ],
      "body": [
        {
          "field": "Net Sales",
          "val1": "91.74",
          "val2": "86.81",
          "chgp": "5.68%",
          "chgp_class": "positive"
        },
        {
          "field": "Operating Profit (PBDIT) excl Other Income",
          "val1": "61.48",
          "val2": "61.70",
          "chgp": "-0.36%",
          "chgp_class": "negative"
        },
        {
          "field": "Interest",
          "val1": "2.23",
          "val2": "4.98",
          "chgp": "-55.22%",
          "chgp_class": "positive"
        },
        {
          "field": "Exceptional Items",
          "val1": "0.00",
          "val2": "0.00",
          "chgp": "",
          "chgp_class": "neutral"
        },
        {
          "field": "Consolidate Net Profit",
          "val1": "162.99",
          "val2": "123.16",
          "chgp": "32.34%",
          "chgp_class": "positive"
        },
        {
          "field": "Operating Profit Margin (Excl OI)",
          "val1": "67.02%",
          "val2": "71.07%",
          "chgp": "-4.05%",
          "chgp_class": "negative"
        }
      ]
    }
  },
  {
    "link": "annual",
    "btn_text": "All Annual Results",
    "header": "Annual Results Snapshot (Consolidated) - Mar'26",
    "rhs": [
      {
        "prefix": "Net Sales ",
        "suffix": "YoY Growth in year ended Mar 2026 is 9.68% vs 4.90% in Mar 2025",
        "dir": 1
      },
      {
        "prefix": "Consolidated Net Profit ",
        "suffix": "YoY Growth in year ended Mar 2026 is 9.70% vs 11.04% in Mar 2025",
        "dir": -1
      }
    ],
    "table": {
      "header": [
        "Mar'26",
        "Mar'25",
        "Change(%)"
      ],
      "body": [
        {
          "field": "Net Sales",
          "val1": "126.16",
          "val2": "115.03",
          "chgp": "9.68%",
          "chgp_class": "positive"
        },
        {
          "field": "Operating Profit (PBDIT) excl Other Income",
          "val1": "74.66",
          "val2": "81.52",
          "chgp": "-8.42%",
          "chgp_class": "negative"
        },
        {
          "field": "Interest",
          "val1": "2.97",
          "val2": "6.31",
          "chgp": "-52.93%",
          "chgp_class": "positive"
        },
        {
          "field": "Exceptional Items",
          "val1": "0.00",
          "val2": "0.00",
          "chgp": "",
          "chgp_class": "neutral"
        },
        {
          "field": "Consolidate Net Profit",
          "val1": "153.50",
          "val2": "139.93",
          "chgp": "9.70%",
          "chgp_class": "positive"
        },
        {
          "field": "Operating Profit Margin (Excl OI)",
          "val1": "59.18%",
          "val2": "70.87%",
          "chgp": "-11.69%",
          "chgp_class": "negative"
        }
      ]
    }
  }
]

Quarterly Results Snapshot (Consolidated) - Jun'26 - QoQstock-summary

Jun'26
Mar'26
Change(%)
Net Sales
34.89
34.42
1.37%
Operating Profit (PBDIT) excl Other Income
15.88
13.18
20.49%
Interest
2.10
0.73
187.67%
Exceptional Items
0.00
0.00
Consolidate Net Profit
83.11
-9.50
974.84%
Operating Profit Margin (Excl OI)
45.51%
38.29%
7.22%
Values in Rs Cr.
Direction Arrows
Net Sales

QoQ Growth in quarter ended Jun 2026 is 1.37% vs 2.26% in Mar 2026

Direction Arrows
Consolidated Net Profit

QoQ Growth in quarter ended Jun 2026 is 974.84% vs -115.32% in Mar 2026

Half Yearly Results Snapshot (Consolidated) - Sep'25stock-summary

Sep'25
Sep'24
Change(%)
Net Sales
58.08
59.46
-2.32%
Operating Profit (PBDIT) excl Other Income
41.44
42.06
-1.47%
Interest
1.49
3.33
-55.26%
Exceptional Items
0.00
0.00
Consolidate Net Profit
100.97
99.86
1.11%
Operating Profit Margin (Excl OI)
71.35%
70.74%
0.61%
Values in Rs Cr.
Direction Arrows
Net Sales

Growth in half year ended Sep 2025 is -2.32% vs 13.13% in Sep 2024

Direction Arrows
Consolidated Net Profit

Growth in half year ended Sep 2025 is 1.11% vs 44.43% in Sep 2024

Nine Monthly Results Snapshot (Consolidated) - Dec'25stock-summary

Dec'25
Dec'24
Change(%)
Net Sales
91.74
86.81
5.68%
Operating Profit (PBDIT) excl Other Income
61.48
61.70
-0.36%
Interest
2.23
4.98
-55.22%
Exceptional Items
0.00
0.00
Consolidate Net Profit
162.99
123.16
32.34%
Operating Profit Margin (Excl OI)
67.02%
71.07%
-4.05%
Values in Rs Cr.
Direction Arrows
Net Sales

YoY Growth in nine months ended Dec 2025 is 5.68% vs 7.57% in Dec 2024

Direction Arrows
Consolidated Net Profit

YoY Growth in nine months ended Dec 2025 is 32.34% vs 21.46% in Dec 2024

Annual Results Snapshot (Consolidated) - Mar'26stock-summary

Mar'26
Mar'25
Change(%)
Net Sales
126.16
115.03
9.68%
Operating Profit (PBDIT) excl Other Income
74.66
81.52
-8.42%
Interest
2.97
6.31
-52.93%
Exceptional Items
0.00
0.00
Consolidate Net Profit
153.50
139.93
9.70%
Operating Profit Margin (Excl OI)
59.18%
70.87%
-11.69%
Values in Rs Cr.
Direction Arrows
Net Sales

YoY Growth in year ended Mar 2026 is 9.68% vs 4.90% in Mar 2025

Direction Arrows
Consolidated Net Profit

YoY Growth in year ended Mar 2026 is 9.70% vs 11.04% in Mar 2025

stock-summaryCompany CV
About IST Ltd stock-summary
stock-summary
IST Ltd
Micro Cap
Auto Components & Equipments
IST Ltd, an Indian based company was incorporated in August, 1975. Presently, the Company is engaged in the manufacture of precision turned, milled, drilled components and stampings for the industries, such as auto component industry, white goods industry, consumer goods industry, and dental and orthopeadic implants.
Company Coordinates stock-summary
Company Details
Delhi-Jaipur Highway No 8, Village Kapriwas Dharuhera Rewari Haryana : 123106
stock-summary
Tel: 91-01274-267346-48
stock-summary
istgroup.ho@gmail.com
Registrar Details
MAS Services Ltd, T-34 , 2nd Floor, Okhla Industrial Area, Phase - II, New Delhi