Entero Healthcar

INR
1,118.35
-19 (-1.67%)
BSENSE

Jun 11, 03:30 PM

BSE+NSE Vol: 49.98 k

  • Price Points
  • Score
  • Mojo Parameters
  • Total Return
  • News and Corporate Actions
  • Key factors
  • Shareholding
  • Financials
  • CompanyCV
stock-summaryPrice Point
High/Low

1Day

52 Week

Valuation
Technical
Day's Volume

CASH

49.98 k (-49.54%) Volume

Shareholding (Mar 2026)

FII

4.03%

Held by 55 FIIs

DII

16.62%

Held by 10 DIIs

Promoter

52.42%

Why is Entero Healthcare Solutions Ltd falling/rising?

12-Jun-2026

As of 11-Jun, Entero Healthcare Solutions Ltd's stock price is at 1,118.35, reflecting a decline of 1.67%. The stock is on a downward trend, trading below key moving averages, with a year-to-date increase of 9.02% but a year-over-year decline of 7.37%.

As of 11-Jun, Entero Healthcare Solutions Ltd's stock price is falling, currently at 1,118.35, which reflects a decrease of 19.0 points or 1.67%. The stock has been on a downward trend, having lost 1.75% over the last two days. Additionally, it is trading below its 5-day, 20-day, 50-day, 100-day, and 200-day moving averages, indicating a bearish momentum. <BR><BR>In the past week, the stock has declined by 1.94%, while over the past month, it has experienced a more significant drop of 9.08%. Despite a year-to-date increase of 9.02%, the stock's performance over the last year shows a decline of 7.37%, which is worse than the benchmark Sensex's decline of 10.52%. <BR><BR>However, there are some positive indicators, such as a strong ability to service debt with a low Debt to EBITDA ratio of 2.55 times and healthy long-term growth in net sales and operating profit. The company has also reported positive results for the last nine consecutive quarters. Despite these strengths, the current market sentiment appears to be negative, contributing to the stock's decline.

View full answer

What does Entero Healthcar do?

11-Jun-2026

Entero Healthcare Solutions Ltd is a small-cap retail company, incorporated in 2018, with net sales of 1,910 Cr and a net profit of 28 Cr as of March 2026. Key financial metrics include a P/E ratio of 40.00 and a market cap of INR 5,035 Cr.

Overview:<BR>Entero Healthcare Solutions Ltd operates in the retailing industry and is classified as a small-cap company.<BR><BR>History:<BR>The company was incorporated in 2018 as Entero Healthcare Solutions Private Limited and later converted into a public limited company, changing its name to Entero Healthcare Solutions Limited. The latest quarterly results reported net sales and net profit for the period ending March 2026.<BR><BR>Financial Snapshot:<BR>- Net Sales: 1,910 Cr (Quarterly Results - Mar 2026)<BR>- Net Profit: 28 Cr (Quarterly Results - Mar 2026)<BR>- Market Cap: INR 5,035 Cr (Small Cap)<BR><BR>Key Metrics:<BR>- P/E: 40.00<BR>- Industry P/E: 20<BR>- Dividend Yield: 0.00%<BR>- Debt Equity: 0.23<BR>- Return on Equity: 7.22%<BR>- Price to Book: 3.00<BR><BR>Contact Details:<BR>Registrar Address: Not available.

View full answer

How big is Entero Healthcar?

11-Jun-2026

As of 10th June, Entero Healthcare Solutions Ltd has a market capitalization of 5,035.00 Cr and reported net sales of 6,591.22 Cr and a net profit of 115.04 Cr over the latest four quarters.

As of 10th June, <BR><BR>Market Cap: Entero Healthcare Solutions Ltd has a market capitalization of 5,035.00 Cr, categorizing it as a Small Cap company.<BR><BR>Recent Quarterly Performance: The sum of Net Sales for the latest 4 quarters is 6,591.22 Cr, while the sum of Net Profit for the same period is 115.04 Cr.<BR><BR>Balance Sheet Snapshot: The reporting period for the balance sheet is March 2025. Shareholder's Funds are valued at 1,724.14 Cr, and Total Assets amount to 2,688.21 Cr.

View full answer

Who are the peers of the Entero Healthcar?

11-Jun-2026

Entero Healthcar's peers include A B Lifestyle, Medplus Health, Aditya Vision, Khemani Distrib., M K Exim India, Novelix Pharma, Purple United, Silgo Retail, and Magson Retail. Entero Healthcar has average management risk and growth, with a 1-year return of -6.21%, outperforming M K Exim India but underperforming Novelix Pharma, which has the highest return at 153.02%.

Peers: The peers of Entero Healthcar are A B Lifestyle, Medplus Health, Aditya Vision, Khemani Distrib., M K Exim India, Novelix Pharma, Purple United, Silgo Retail, and Magson Retail.<BR><BR>Quality Snapshot: Excellent management risk is observed at Aditya Vision, Khemani Distrib., M K Exim India, and Purple United, while Average management risk is found at Entero Healthcar and A B Lifestyle. Below Average management risk is present at Medplus Health and Novelix Pharma. For growth, Excellent growth is noted at Aditya Vision, Medplus Health, Entero Healthcar, and Purple United, while Below Average growth is seen at A B Lifestyle, Khemani Distrib., M K Exim India, and Silgo Retail. Average growth is reported for Novelix Pharma and Magson Retail. In terms of capital structure, Excellent capital structure is attributed to M K Exim India, Good capital structure is observed at Entero Healthcar, Khemani Distrib., and Silgo Retail, while Below Average capital structure is found at A B Lifestyle, Medplus Health, Novelix Pharma, Purple United, and Magson Retail.<BR><BR>Return Snapshot: The peer with the highest 1-year return is Novelix Pharma at 153.02%, while the lowest is M K Exim India at -25.20%. Entero Healthcar's 1-year return is -6.21%, which is higher than M K Exim India but lower than Novelix Pharma. Additionally, Khemani Distrib., M K Exim India, and Magson Retail have negative six-month returns.

View full answer

Should I buy, sell or hold Entero Healthcare Solutions Ltd?

28-May-2026

Are Entero Healthcare Solutions Ltd latest results good or bad?

26-May-2026

Entero Healthcare Solutions Ltd's latest results show strong revenue growth with a 42.63% year-on-year increase in net sales, reaching ₹1,909.93 crores. However, profit growth is modest at 9.03%, raising concerns about margin sustainability and cost management.

Entero Healthcare Solutions Ltd's latest results present a mixed picture. On the positive side, the company achieved a significant increase in net sales, with a sequential growth of 11.92% and a remarkable year-on-year growth of 42.63%, reaching an all-time high of ₹1,909.93 crores in Q4 FY26. This reflects strong operational momentum and effective scaling of its business.<BR><BR>However, the growth in net profit was less impressive, with only a 1.38% increase quarter-on-quarter and a modest 9.03% year-on-year growth, totaling ₹28.01 crores. This slower profit growth raises concerns about margin sustainability and cost management, particularly as the profit after tax margin remains relatively low at 2.36%. Additionally, rising interest costs and increased depreciation charges have further pressured profitability.<BR><BR>Overall, while Entero Healthcare demonstrates strong revenue growth and improved operating margins, the challenges in translating this growth into substantial profit gains suggest caution regarding the sustainability of its current performance. The results indicate that while the company is expanding, it faces significant operational hurdles that need to be addressed to enhance profitability.

View full answer

When is the next results date for Entero Healthcare Solutions Ltd?

19-May-2026

The next results date for Entero Healthcare Solutions Ltd is 25 May 2026.

The next results date for Entero Healthcare Solutions Ltd is scheduled for 25 May 2026.

View full answer

Is Entero Healthcar technically bullish or bearish?

20-Nov-2025

As of November 19, 2025, Entero Healthcare's technical trend is bearish with moderate strength, indicated by bearish MACD, Bollinger Bands, moving averages, and KST, despite mixed signals from Dow Theory.

As of 19 November 2025, the technical trend has changed from mildly bearish to bearish. The current stance is bearish with moderate strength. Key indicators driving this include a bearish MACD on the weekly timeframe, bearish signals from Bollinger Bands on both weekly and monthly timeframes, and bearish moving averages on the daily timeframe. Additionally, the KST is bearish on the weekly, and the OBV shows a mildly bearish trend on the monthly. The Dow Theory reflects a mildly bullish stance on the weekly but is mildly bearish on the monthly, indicating mixed signals. Overall, the prevailing bearish indicators suggest a negative outlook for Entero Healthcare.

View full answer

Is Entero Healthcar overvalued or undervalued?

17-Nov-2025

As of November 14, 2025, Entero Healthcare is considered very attractive and undervalued with a PE ratio of 44.13 and a PEG ratio of 0.31, despite a challenging year-to-date return of -20.6%, indicating strong growth potential compared to its peers.

As of 14 November 2025, Entero Healthcare has moved from an attractive to a very attractive valuation grade. The company is currently considered undervalued, with a PE ratio of 44.13, an EV to EBITDA of 23.43, and a PEG ratio of 0.31, indicating strong growth potential relative to its price. <BR><BR>In comparison to its peers, Entero's PE ratio significantly exceeds that of TCS at 22.34 and Infosys at 22.19, while its EV to EBITDA is higher than TCS's 15.7 but lower than that of LTI Mindtree at 23.98. Despite a challenging year with a year-to-date return of -20.6% compared to the Sensex's 8.22%, Entero Healthcare's strong valuation metrics suggest it remains an attractive investment opportunity in the retailing sector.

View full answer

How has been the historical performance of Entero Healthcar?

15-Nov-2025

Entero Healthcar has shown significant growth over the past five years, with net sales increasing from 1,779.74 Cr in March 2021 to 5,095.78 Cr in March 2025, and profit after tax turning positive at 107.43 Cr. The company has improved its operating profit and total assets while achieving a net cash inflow from investing activities in March 2025.

Answer:<BR>The historical performance of Entero Healthcar shows significant growth over the past five years, particularly in net sales and profitability.<BR><BR>Breakdown:<BR>Entero Healthcar's net sales have increased from 1,779.74 Cr in March 2021 to 5,095.78 Cr in March 2025, reflecting a strong upward trend. Total operating income has followed a similar trajectory, rising from 1,779.74 Cr to 5,095.78 Cr during the same period. The company's total expenditure, excluding depreciation, has also grown, reaching 4,924.23 Cr in March 2025, up from 1,758.19 Cr in March 2021. Operating profit, excluding other income, has improved significantly, moving from 21.55 Cr in March 2021 to 171.55 Cr in March 2025. This growth in operating profit has contributed to a profit before tax of 138.74 Cr in March 2025, a substantial increase from the losses recorded in previous years. The profit after tax has turned positive, reaching 107.43 Cr in March 2025, compared to losses in earlier years. The company's total assets have increased from 748.97 Cr in March 2020 to 2,688.21 Cr in March 2025, while total liabilities have also risen, from 748.97 Cr to 2,688.21 Cr. Cash flow from operating activities has shown negative trends, but cash flow from investing activities has turned positive in March 2025, indicating a net cash inflow of 81.00 Cr. Overall, Entero Healthcar has demonstrated a remarkable recovery and growth in its financial performance over the past five years.

View full answer

Who are the top shareholders of the Entero Healthcar?

17-Jul-2025

The top shareholders of Entero Healthcare include Orbimed Asia III Mauritius Limited with 38.01%, 70 foreign institutional investors holding 19.92%, and Surbhi Singh of the Prasid Uno Family Trust with 10.46%. Additionally, mutual funds hold 6.09%, while individual investors own 5.41% of the company.

The top shareholders of Entero Healthcare include several key players. The majority of the shares are held by promoters, with Orbimed Asia III Mauritius Limited being the largest individual promoter, holding 38.01%. Additionally, there are 70 foreign institutional investors (FIIs) collectively holding 19.92% of the shares. Mutual funds have a presence as well, with 7 schemes holding 6.09%. Among public shareholders, Surbhi Singh, representing the Prasid Uno Family Trust, is the largest, holding 10.46%. Individual investors collectively own 5.41% of the company.

View full answer

Has Entero Healthcar declared dividend?

06-Jun-2025

No Dividend History Available

iScoreScore
Click here to find our call on this stock
Strong Sell
Sell
Hold
Buy
Strong Buy

Dashboard

1

Strong ability to service debt as the company has a low Debt to EBITDA ratio of 2.55 times

 
2

Healthy long term growth as Net Sales has grown by an annual rate of 29.63% and Operating profit at 60.14%

 
3

The company has declared Positive results for the last 9 consecutive quarters

4

With ROCE of 10.7, it has a Attractive valuation with a 2.5 Enterprise value to Capital Employed

5

High Institutional Holdings at 20.65%

stock-summaryMojo Parameters

Mojo Parameters

Loading Valuation Snapshot...

Stock DNA

stock-summary
Industry

Retailing

stock-summary
Market cap

INR 4,908 Cr (Small Cap)

stock-summary
P/E

40.00

stock-summary
Industry P/E

20

stock-summary
Dividend Yield

0.00%

stock-summary
Debt Equity

0.23

stock-summary
Return on Equity

7.22%

stock-summary
Price to Book

2.91

Revenue and Profits:
Net Sales:
1,910 Cr
(Quarterly Results - Mar 2026)
Net Profit:
28 Cr
stock-summaryTotal Returns
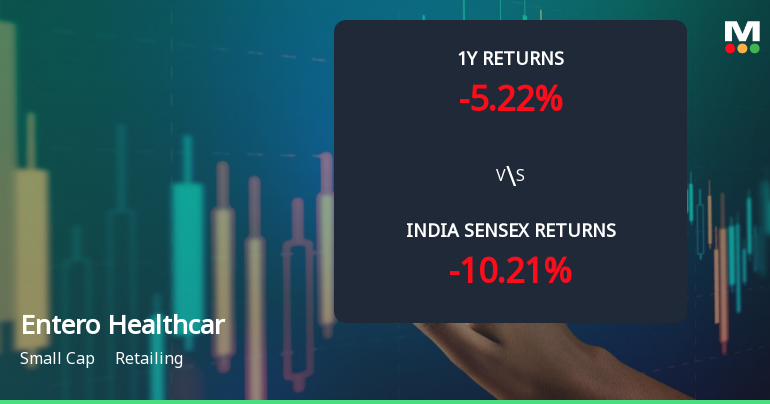
Total Returns (Price + Dividend) stock-summary
Dividend Yield (0%)
TimePeriod
Price Return
Dividend Return
Total Return
3 Months
9.24%
0%
9.24%
6 Months
11.05%
0%
11.05%
1 Year
-7.37%
0%
-7.37%
2 Years
9.16%
0%
9.16%
3 Years
0%
0%
0.0%
4 Years
0%
0%
0.0%
5 Years
0%
0%
0.0%

Entero Healthcar for the last several years.

Risk Adjusted Returns v/s stock-summary
Returns Beta
Icon
Beta has not been calculated since enough price history is not available
stock-summaryNews & Corporate Actions

Announcements stock-summary

Announcement under Regulation 30 (LODR)-Earnings Call Transcript

02-Jun-2026 | Source : BSE

Transcript of Earnings Call / Conference Call

Announcement under Regulation 30 (LODR)-Newspaper Publication

27-May-2026 | Source : BSE

Newspaper publication for Audited Financial Results of the Company for the Quarter and Year ended March 31 2026.

Announcement under Regulation 30 (LODR)-Analyst / Investor Meet - Outcome

26-May-2026 | Source : BSE

Recording of Earnings Call/ Conference Call

Corporate Actions stock-summary

stock-summary
BOARD MEETING

No Upcoming Board Meetings

stock-summary
DIVIDEND

No Dividend history available

stock-summary
SPLITS

No Splits history available

stock-summary
BONUS

No Bonus history available

stock-summary
RIGHTS

No Rights history available

stock-summaryKey Factors

Quality key factors stock-summary

Factor
Value
Sales Growth (5y)
29.63%
EBIT Growth (5y)
60.14%
EBIT to Interest (avg)
2.93
Debt to EBITDA (avg)
2.54
Net Debt to Equity (avg)
0.23
Sales to Capital Employed (avg)
2.38
Tax Ratio
18.68%
Dividend Payout Ratio
0
Pledged Shares
0
Institutional Holding
20.65%
ROCE (avg)
8.33%
ROE (avg)
6.36%

Valuation key factors

Factor
Value
P/E Ratio
40
Industry P/E
20
Price to Book Value
2.89
EV to EBIT
23.62
EV to EBITDA
19.78
EV to Capital Employed
2.54
EV to Sales
0.80
PEG Ratio
1.40
Dividend Yield
NA
ROCE (Latest)
10.74%
ROE (Latest)
7.22%

Technicals key factors

Indicator
Weekly
Monthly
MACD
Mildly Bearish
RSI
No Signal
Bearish
Bollinger Bands
Mildly Bearish
Bearish
Moving Averages
Mildly Bullish (Daily)
KST
Bullish
Dow Theory
Mildly Bearish
Mildly Bullish
OBV
Mildly Bearish
No Trend
stock-summary Technical Indicator Scale: Bearish, Mildly Bearish, Sideways, Mildly Bullish, Bullish  Turned 
stock-summaryShareholding
Shareholding Snapshot : Mar 2026stock-summary
Shareholding Compare (%holding) stock-summary
Majority shareholders

Promoters

Pledged Promoter Holdings

None

Mutual Funds

Held by 8 Schemes (9.52%)

FIIs

Held by 55 FIIs (4.03%)

Promoter with highest holding

Orbimed Asia Iii Mauritius Limited (38.01%)

Highest Public shareholder

Surbhi Singh(prasid Uno Family Trust) (10.46%)

Individual Investors Holdings

12.25%

stock-summaryFinancial
[
  {
    "link": "quarterly",
    "btn_text": "All Quarterly Results",
    "header": "Quarterly Results Snapshot (Consolidated) - Mar'26 - QoQ",
    "rhs": [
      {
        "prefix": "Net Sales ",
        "suffix": "QoQ Growth in quarter ended Mar 2026 is 11.92% vs 8.63% in Dec 2025",
        "dir": 1
      },
      {
        "prefix": "Consolidated Net Profit ",
        "suffix": "QoQ Growth in quarter ended Mar 2026 is 1.38% vs -12.56% in Dec 2025",
        "dir": 1
      }
    ],
    "table": {
      "header": [
        "Mar'26",
        "Dec'25",
        "Change(%)"
      ],
      "body": [
        {
          "field": "Net Sales",
          "val1": "1,909.93",
          "val2": "1,706.52",
          "chgp": "11.92%",
          "chgp_class": "positive"
        },
        {
          "field": "Operating Profit (PBDIT) excl Other Income",
          "val1": "86.04",
          "val2": "67.78",
          "chgp": "26.94%",
          "chgp_class": "positive"
        },
        {
          "field": "Interest",
          "val1": "17.31",
          "val2": "14.01",
          "chgp": "23.55%",
          "chgp_class": "negative"
        },
        {
          "field": "Exceptional Items",
          "val1": "0.00",
          "val2": "-8.18",
          "chgp": "100.00%",
          "chgp_class": "positive"
        },
        {
          "field": "Consolidate Net Profit",
          "val1": "28.01",
          "val2": "27.63",
          "chgp": "1.38%",
          "chgp_class": "positive"
        },
        {
          "field": "Operating Profit Margin (Excl OI)",
          "val1": "4.50%",
          "val2": "3.97%",
          "chgp": "0.53%",
          "chgp_class": "positive"
        }
      ]
    }
  },
  {
    "link": "half-yearly",
    "btn_text": "All Half Yearly Results",
    "header": "Half Yearly Results Snapshot (Consolidated) - Sep'25",
    "rhs": [
      {
        "prefix": "Net Sales ",
        "suffix": " Growth in half year ended Sep 2025 is 24.07% vs 26.50% in Sep 2024",
        "dir": -1
      },
      {
        "prefix": "Consolidated Net Profit ",
        "suffix": " Growth in half year ended Sep 2025 is 35.93% vs 284.34% in Sep 2024",
        "dir": -1
      }
    ],
    "table": {
      "header": [
        "Sep'25",
        "Sep'24",
        "Change(%)"
      ],
      "body": [
        {
          "field": "Net Sales",
          "val1": "2,974.77",
          "val2": "2,397.73",
          "chgp": "24.07%",
          "chgp_class": "positive"
        },
        {
          "field": "Operating Profit (PBDIT) excl Other Income",
          "val1": "112.14",
          "val2": "72.62",
          "chgp": "54.42%",
          "chgp_class": "positive"
        },
        {
          "field": "Interest",
          "val1": "23.06",
          "val2": "21.16",
          "chgp": "8.98%",
          "chgp_class": "negative"
        },
        {
          "field": "Exceptional Items",
          "val1": "0.00",
          "val2": "0.00",
          "chgp": "",
          "chgp_class": "neutral"
        },
        {
          "field": "Consolidate Net Profit",
          "val1": "59.40",
          "val2": "43.70",
          "chgp": "35.93%",
          "chgp_class": "positive"
        },
        {
          "field": "Operating Profit Margin (Excl OI)",
          "val1": "3.77%",
          "val2": "3.03%",
          "chgp": "0.74%",
          "chgp_class": "positive"
        }
      ]
    }
  },
  {
    "link": "nine-monthly",
    "btn_text": "All Nine Monthly Results",
    "header": "Nine Monthly Results Snapshot (Consolidated) - Dec'25",
    "rhs": [
      {
        "prefix": "Net Sales ",
        "suffix": "YoY Growth in nine months ended Dec 2025 is 24.61% vs 30.07% in Dec 2024",
        "dir": -1
      },
      {
        "prefix": "Consolidated Net Profit ",
        "suffix": "YoY Growth in nine months ended Dec 2025 is 25.88% vs 280.94% in Dec 2024",
        "dir": -1
      }
    ],
    "table": {
      "header": [
        "Dec'25",
        "Dec'24",
        "Change(%)"
      ],
      "body": [
        {
          "field": "Net Sales",
          "val1": "4,681.29",
          "val2": "3,756.73",
          "chgp": "24.61%",
          "chgp_class": "positive"
        },
        {
          "field": "Operating Profit (PBDIT) excl Other Income",
          "val1": "179.92",
          "val2": "122.64",
          "chgp": "46.71%",
          "chgp_class": "positive"
        },
        {
          "field": "Interest",
          "val1": "37.07",
          "val2": "31.13",
          "chgp": "19.08%",
          "chgp_class": "negative"
        },
        {
          "field": "Exceptional Items",
          "val1": "-8.18",
          "val2": "0.00",
          "chgp": "",
          "chgp_class": "neutral"
        },
        {
          "field": "Consolidate Net Profit",
          "val1": "87.03",
          "val2": "69.14",
          "chgp": "25.88%",
          "chgp_class": "positive"
        },
        {
          "field": "Operating Profit Margin (Excl OI)",
          "val1": "3.84%",
          "val2": "3.26%",
          "chgp": "0.58%",
          "chgp_class": "positive"
        }
      ]
    }
  },
  {
    "link": "annual",
    "btn_text": "All Annual Results",
    "header": "Annual Results Snapshot (Consolidated) - Mar'26",
    "rhs": [
      {
        "prefix": "Net Sales ",
        "suffix": "YoY Growth in year ended Mar 2026 is 29.35% vs 29.92% in Mar 2025",
        "dir": -1
      },
      {
        "prefix": "Consolidated Net Profit ",
        "suffix": "YoY Growth in year ended Mar 2026 is 21.32% vs 142.44% in Mar 2025",
        "dir": -1
      }
    ],
    "table": {
      "header": [
        "Mar'26",
        "Mar'25",
        "Change(%)"
      ],
      "body": [
        {
          "field": "Net Sales",
          "val1": "6,591.21",
          "val2": "5,095.78",
          "chgp": "29.35%",
          "chgp_class": "positive"
        },
        {
          "field": "Operating Profit (PBDIT) excl Other Income",
          "val1": "265.95",
          "val2": "171.55",
          "chgp": "55.03%",
          "chgp_class": "positive"
        },
        {
          "field": "Interest",
          "val1": "54.39",
          "val2": "41.62",
          "chgp": "30.68%",
          "chgp_class": "negative"
        },
        {
          "field": "Exceptional Items",
          "val1": "-8.18",
          "val2": "0.00",
          "chgp": "",
          "chgp_class": "neutral"
        },
        {
          "field": "Consolidate Net Profit",
          "val1": "115.04",
          "val2": "94.82",
          "chgp": "21.32%",
          "chgp_class": "positive"
        },
        {
          "field": "Operating Profit Margin (Excl OI)",
          "val1": "4.03%",
          "val2": "3.37%",
          "chgp": "0.66%",
          "chgp_class": "positive"
        }
      ]
    }
  }
]

Quarterly Results Snapshot (Consolidated) - Mar'26 - QoQstock-summary

Mar'26
Dec'25
Change(%)
Net Sales
1,909.93
1,706.52
11.92%
Operating Profit (PBDIT) excl Other Income
86.04
67.78
26.94%
Interest
17.31
14.01
23.55%
Exceptional Items
0.00
-8.18
100.00%
Consolidate Net Profit
28.01
27.63
1.38%
Operating Profit Margin (Excl OI)
4.50%
3.97%
0.53%
Values in Rs Cr.
Direction Arrows
Net Sales

QoQ Growth in quarter ended Mar 2026 is 11.92% vs 8.63% in Dec 2025

Direction Arrows
Consolidated Net Profit

QoQ Growth in quarter ended Mar 2026 is 1.38% vs -12.56% in Dec 2025

Half Yearly Results Snapshot (Consolidated) - Sep'25stock-summary

Sep'25
Sep'24
Change(%)
Net Sales
2,974.77
2,397.73
24.07%
Operating Profit (PBDIT) excl Other Income
112.14
72.62
54.42%
Interest
23.06
21.16
8.98%
Exceptional Items
0.00
0.00
Consolidate Net Profit
59.40
43.70
35.93%
Operating Profit Margin (Excl OI)
3.77%
3.03%
0.74%
Values in Rs Cr.
Direction Arrows
Net Sales

Growth in half year ended Sep 2025 is 24.07% vs 26.50% in Sep 2024

Direction Arrows
Consolidated Net Profit

Growth in half year ended Sep 2025 is 35.93% vs 284.34% in Sep 2024

Nine Monthly Results Snapshot (Consolidated) - Dec'25stock-summary

Dec'25
Dec'24
Change(%)
Net Sales
4,681.29
3,756.73
24.61%
Operating Profit (PBDIT) excl Other Income
179.92
122.64
46.71%
Interest
37.07
31.13
19.08%
Exceptional Items
-8.18
0.00
Consolidate Net Profit
87.03
69.14
25.88%
Operating Profit Margin (Excl OI)
3.84%
3.26%
0.58%
Values in Rs Cr.
Direction Arrows
Net Sales

YoY Growth in nine months ended Dec 2025 is 24.61% vs 30.07% in Dec 2024

Direction Arrows
Consolidated Net Profit

YoY Growth in nine months ended Dec 2025 is 25.88% vs 280.94% in Dec 2024

Annual Results Snapshot (Consolidated) - Mar'26stock-summary

Mar'26
Mar'25
Change(%)
Net Sales
6,591.21
5,095.78
29.35%
Operating Profit (PBDIT) excl Other Income
265.95
171.55
55.03%
Interest
54.39
41.62
30.68%
Exceptional Items
-8.18
0.00
Consolidate Net Profit
115.04
94.82
21.32%
Operating Profit Margin (Excl OI)
4.03%
3.37%
0.66%
Values in Rs Cr.
Direction Arrows
Net Sales

YoY Growth in year ended Mar 2026 is 29.35% vs 29.92% in Mar 2025

Direction Arrows
Consolidated Net Profit

YoY Growth in year ended Mar 2026 is 21.32% vs 142.44% in Mar 2025

stock-summaryCompany CV
About Entero Healthcare Solutions Ltd stock-summary
stock-summary
Entero Healthcare Solutions Ltd
Small Cap
Retailing
Entero Healthcare Solutions Limited was incorporated as `Entero Healthcare Solutions Private Limited' dated January 10, 2018, issued by the Registrar of Companies, Central Registration Centre, at New Delhi. Subsequently, the Company was converted into a public limited company and the name of the Company was changed to `Entero Healthcare Solutions Limited', and a fresh certificate of incorporation dated August 25, 2023, was issued by the RoC.
Company Coordinates stock-summary
Icon
No Company Details Available