
Compare Epack Durable with Similar Stocks
Dashboard
Weak Long Term Fundamental Strength with a -14.68% CAGR growth in Operating Profits over the last 5 years
- Low ability to service debt as the company has a high Debt to EBITDA ratio of 6.56 times
- The company has been able to generate a Return on Equity (avg) of 3.07% signifying low profitability per unit of shareholders funds
The company has declared Negative results for the last 3 consecutive quarters
Below par performance in long term as well as near term
Stock DNA
Electronics & Appliances
INR 2,154 Cr (Small Cap)
660.00
83
0.00%
0.75
0.34%
2.21
Total Returns (Price + Dividend) 
Epack Durable for the last several years.
Risk Adjusted Returns v/s
Returns Beta

News
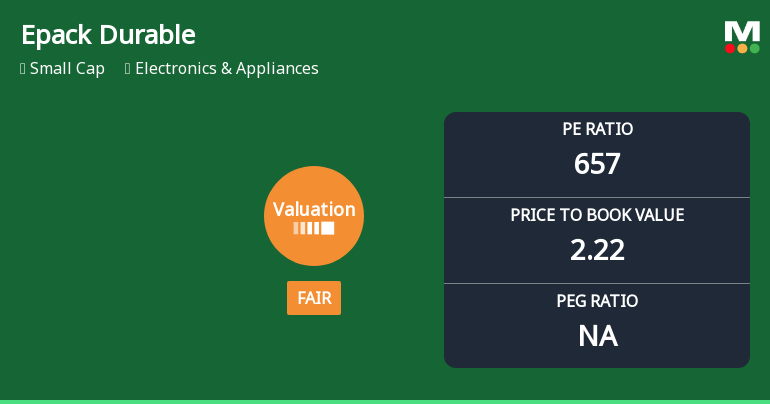
Epack Durable Ltd Valuation Shifts Amidst Market Challenges
Epack Durable Ltd, a small-cap player in the Electronics & Appliances sector, has witnessed a notable shift in its valuation parameters, moving from an attractive to a fair rating. This change comes amid a backdrop of subdued stock performance and challenging market conditions, prompting a reassessment of its price-to-earnings and price-to-book value metrics relative to historical and peer benchmarks.
Read full news article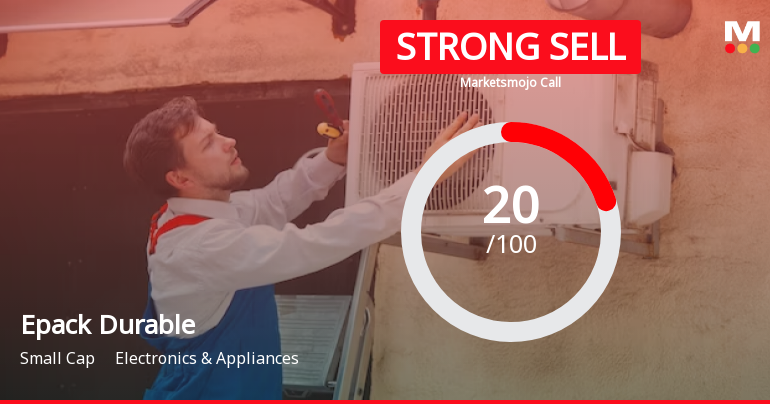
Epack Durable Ltd is Rated Strong Sell
Epack Durable Ltd is rated Strong Sell by MarketsMOJO, with this rating last updated on 04 May 2026. However, the analysis and financial metrics discussed here reflect the company’s current position as of 01 June 2026, providing investors with the latest insights into its performance and outlook.
Read full news article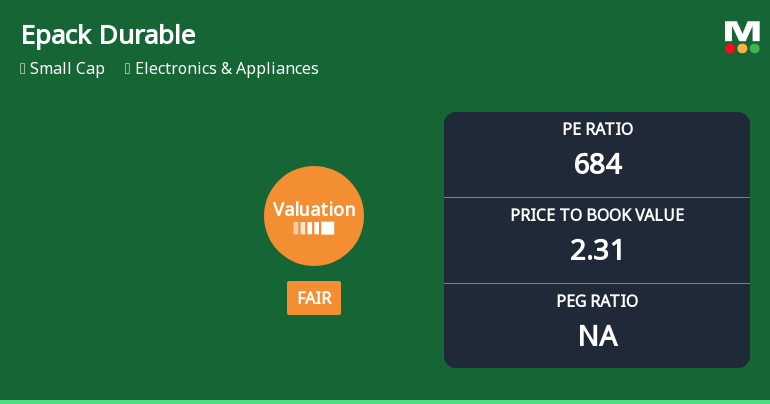
Epack Durable Ltd Valuation Shifts Signal Deteriorating Price Attractiveness
Epack Durable Ltd, a small-cap player in the Electronics & Appliances sector, has seen a notable shift in its valuation parameters, moving from an attractive to a fair rating. Despite a recent downgrade in its Mojo Grade to Strong Sell, the company’s valuation metrics reveal a complex picture of stretched price multiples and subdued returns, raising questions about its price attractiveness relative to peers and historical benchmarks.
Read full news article Announcements
Announcement under Regulation 30 (LODR)-Earnings Call Transcript
27-May-2026 | Source : BSEEPACK Durable Limited has submitted Transcript of Earning Call held on May 21 2026.
Announcement under Regulation 30 (LODR)-Newspaper Publication
22-May-2026 | Source : BSEEPACK Durable Limited has informed the Exchange about copy of Newspaper Publication.
Announcement under Regulation 30 (LODR)-Analyst / Investor Meet - Outcome
21-May-2026 | Source : BSEEPACK Durable Limited has informed the Exchange about Link of Audio Recording of Investor Call held earlier in the day ie. May 21 2026.
Corporate Actions

No Upcoming Board Meetings

No Dividend history available

No Splits history available

No Bonus history available

No Rights history available
Quality key factors
Valuation key factors
Technicals key factors
 Technical Indicator Scale: Bearish, Mildly Bearish, Sideways, Mildly Bullish, Bullish Turned
 Shareholding Snapshot : Mar 2026
Shareholding Compare (%holding)
Promoters
3.8544
Held by 4 Schemes (4.81%)
Held by 18 FIIs (0.29%)
Sanjay Singhania (8.83%)
Augusta Investments Zero Pte. Ltd. (6.1%)
32.52%
Quarterly Results Snapshot (Consolidated) - Mar'26 - QoQ

QoQ Growth in quarter ended Mar 2026 is 38.18% vs 100.58% in Dec 2025
QoQ Growth in quarter ended Mar 2026 is -99.23% vs 111.64% in Dec 2025
Half Yearly Results Snapshot (Consolidated) - Sep'25
Growth in half year ended Sep 2025 is -23.91% vs 87.18% in Sep 2024
Growth in half year ended Sep 2025 is -95.64% vs 463.02% in Sep 2024
Nine Monthly Results Snapshot (Consolidated) - Dec'25
YoY Growth in nine months ended Dec 2025 is -14.68% vs 70.90% in Dec 2024
YoY Growth in nine months ended Dec 2025 is -81.41% vs 131.17% in Dec 2024
Annual Results Snapshot (Consolidated) - Mar'26
YoY Growth in year ended Mar 2026 is -12.73% vs 52.93% in Mar 2025
YoY Growth in year ended Mar 2026 is -94.09% vs 55.89% in Mar 2025
About Epack Durable Ltd

Company Coordinates


