
Compare Stove Kraft with Similar Stocks
Stock DNA
Electronics & Appliances
INR 2,525 Cr (Small Cap)
60.00
NA
0.39%
0.06
8.33%
5.00
Total Returns (Price + Dividend) 
Latest dividend: 2.9863636363636363 per share ex-dividend date: Sep-19-2025
Risk Adjusted Returns v/s
Returns Beta

News
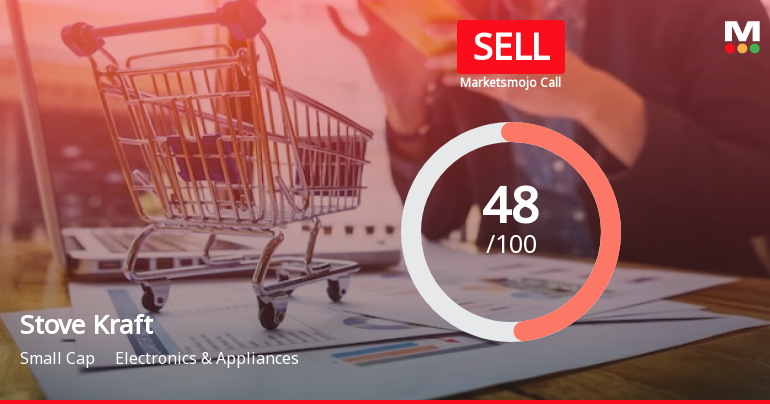
Stove Kraft Ltd is Rated Sell by MarketsMOJO
Stove Kraft Ltd is rated Sell by MarketsMOJO, with this rating last updated on 15 June 2026. While the rating change occurred on that date, the analysis and financial metrics presented here reflect the stock’s current position as of 25 June 2026, providing investors with the latest insights into the company’s performance and outlook.
Read full news article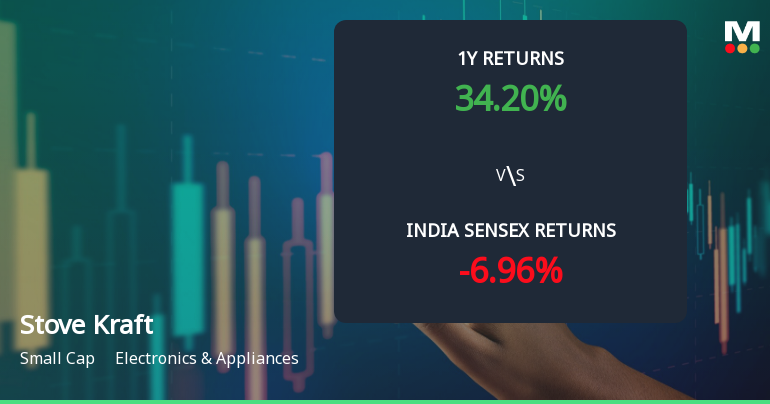
Stove Kraft Ltd Sees Bullish Momentum Shift Amid Mixed Technical Signals
Stove Kraft Ltd has demonstrated a notable shift in price momentum, moving from a mildly bullish to a bullish technical trend, supported by a series of positive signals across key indicators such as MACD, Bollinger Bands, and moving averages. This technical evolution coincides with a strong price performance that outpaces the broader market, signalling renewed investor interest in this Electronics & Appliances small-cap stock.
Read full news article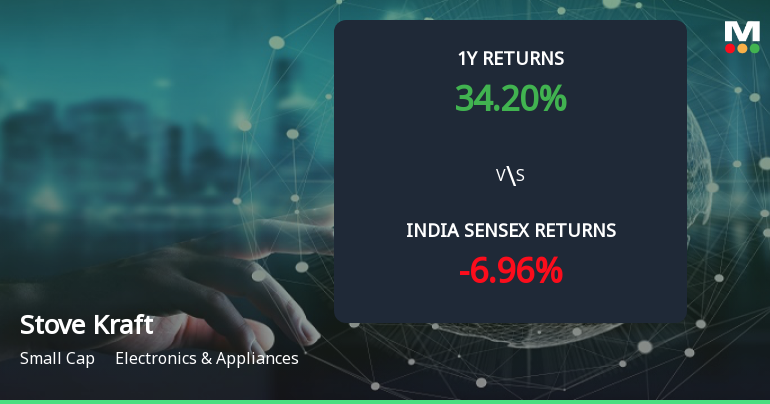
Golden Cross Forms in Stove Kraft Ltd Amid Mixed Technical Signals and Strong Recent Rally
The 50-day moving average has crossed above the 200-day moving average for Stove Kraft Ltd, signalling a golden cross on 23 Jun 2026. Yet, the broader technical picture is nuanced, with weekly indicators mostly bullish but monthly momentum showing mild bearishness. This divergence raises questions about the reliability of the crossover as a standalone signal.
Read full news article Announcements
Announcement under Regulation 30 (LODR)-Analyst / Investor Meet - Intimation
25-May-2026 | Source : BSEInvestor conference
Compliances-Reg.24(A)-Annual Secretarial Compliance
25-May-2026 | Source : BSEAnnual Secretarial Compliance Report
Board Comments On The Fine Levied By NSE
25-May-2026 | Source : BSEBoard comments on fine levied by NSE
Corporate Actions

No Upcoming Board Meetings

Stove Kraft Ltd has declared 30% dividend, ex-date: 19 Sep 25

No Splits history available

No Bonus history available

No Rights history available
Quality key factors
Valuation key factors
Technicals key factors
 Technical Indicator Scale: Bearish, Mildly Bearish, Sideways, Mildly Bullish, Bullish Turned
 Shareholding Snapshot : Mar 2026
Shareholding Compare (%holding)
Promoters
15.7019
Held by 3 Schemes (6.16%)
Held by 27 FIIs (0.81%)
Rajendra Gandhi (55.18%)
Bandhan Small Cap Fund (3.74%)
29.37%
Quarterly Results Snapshot (Standalone) - Mar'26 - QoQ

QoQ Growth in quarter ended Mar 2026 is 9.55% vs -20.25% in Dec 2025
QoQ Growth in quarter ended Mar 2026 is 45.78% vs -80.57% in Dec 2025
Half Yearly Results Snapshot (Standalone) - Sep'25
Growth in half year ended Sep 2025 is 11.16% vs 8.15% in Sep 2024
Growth in half year ended Sep 2025 is 27.57% vs 0.81% in Sep 2024
Nine Monthly Results Snapshot (Standalone) - Dec'25

YoY Growth in nine months ended Dec 2025 is 4.93% vs 9.40% in Dec 2024
YoY Growth in nine months ended Dec 2025 is -3.02% vs 17.73% in Dec 2024
Annual Results Snapshot (Standalone) - Mar'26
YoY Growth in year ended Mar 2026 is 10.87% vs 6.27% in Mar 2025
YoY Growth in year ended Mar 2026 is 9.04% vs 12.80% in Mar 2025
About Stove Kraft Ltd

Company Coordinates


