
Compare Epigral with Similar Stocks
Stock DNA
Specialty Chemicals
INR 4,722 Cr (Small Cap)
14.00
42
0.45%
0.26
14.94%
2.16
Total Returns (Price + Dividend) 
Latest dividend: 5 per share ex-dividend date: Jun-01-2026
Risk Adjusted Returns v/s
Returns Beta

News
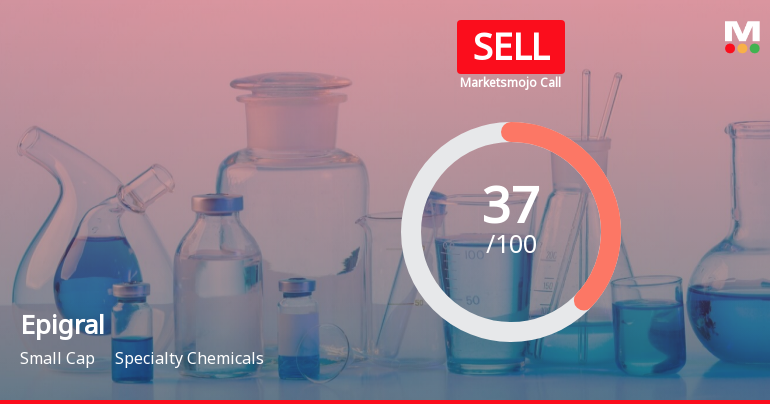
Epigral Ltd is Rated Sell
Epigral Ltd is rated 'Sell' by MarketsMOJO, with this rating last updated on 26 December 2025. However, the analysis and financial metrics discussed here reflect the stock's current position as of 03 June 2026, providing investors with an up-to-date view of the company’s fundamentals, returns, and market performance.
Read full news article
Epigral Ltd is Rated Sell
Epigral Ltd is rated 'Sell' by MarketsMOJO, with this rating last updated on 26 Dec 2025. However, the analysis and financial metrics discussed here reflect the stock's current position as of 23 May 2026, providing investors with an up-to-date view of the company’s fundamentals, returns, and market performance.
Read full news article
Epigral Ltd is Rated Sell
Epigral Ltd is rated 'Sell' by MarketsMOJO, with this rating last updated on 26 Dec 2025. However, the analysis and financial metrics discussed here reflect the company’s current position as of 23 May 2026, providing investors with an up-to-date view of its performance and outlook.
Read full news article Announcements
Announcement under Regulation 30 (LODR)-Analyst / Investor Meet - Intimation
10-Jun-2026 | Source : BSEEpigral Limited has informed the Exchange about One-on-One Meeting through V.C. with Investor / Analyst on June 16 2026.
Shareholder Meeting / Postal Ballot-Scrutinizers Report
09-Jun-2026 | Source : BSESubmission of Scrutinizers Report of 19th AGM held on 08.06.2026.
Shareholder Meeting / Postal Ballot-Outcome of AGM
08-Jun-2026 | Source : BSEProceedings of 19th AGM held on 08.06.2026.
Corporate Actions

No Upcoming Board Meetings

Epigral Ltd has declared 50% dividend, ex-date: 01 Jun 26

No Splits history available

No Bonus history available

No Rights history available
Quality key factors
Valuation key factors
Technicals key factors
 Technical Indicator Scale: Bearish, Mildly Bearish, Sideways, Mildly Bullish, Bullish Turned
 Shareholding Snapshot : Mar 2026
Shareholding Compare (%holding)
Promoters
None
Held by 3 Schemes (4.9%)
Held by 43 FIIs (1.54%)
Ashishbhai Natawarlal Soparkar (14.65%)
Hsbc Mutual Fund - Hsbc Value Fund (2.59%)
17.93%
Quarterly Results Snapshot (Consolidated) - Mar'26 - QoQ

QoQ Growth in quarter ended Mar 2026 is 23.29% vs 1.66% in Dec 2025
QoQ Growth in quarter ended Mar 2026 is 106.98% vs -23.64% in Dec 2025
Half Yearly Results Snapshot (Consolidated) - Sep'25

Growth in half year ended Sep 2025 is -6.53% vs 36.89% in Sep 2024
Growth in half year ended Sep 2025 is 26.76% vs 140.53% in Sep 2024
Nine Monthly Results Snapshot (Consolidated) - Dec'25
YoY Growth in nine months ended Dec 2025 is -6.84% vs 36.88% in Dec 2024
YoY Growth in nine months ended Dec 2025 is -7.30% vs 128.37% in Dec 2024
Annual Results Snapshot (Consolidated) - Mar'26
YoY Growth in year ended Mar 2026 is -0.90% vs 32.19% in Mar 2025
YoY Growth in year ended Mar 2026 is -7.19% vs 82.62% in Mar 2025
About Epigral Ltd

Company Coordinates


