
Compare Equippp Social with Similar Stocks
Dashboard
With ROCE of 16.7, it has a Very Expensive valuation with a 13.2 Enterprise value to Capital Employed
- The stock is trading at a discount compared to its peers' average historical valuations
- Over the past year, while the stock has generated a return of -6.40%, its profits have risen by 123% ; the PEG ratio of the company is 0.5
Consistent Underperformance against the benchmark over the last 3 years
Stock DNA
Computers - Software & Consulting
INR 181 Cr (Micro Cap)
102.00
21
0.00%
0.53
19.28%
19.98
Total Returns (Price + Dividend) 
Latest dividend: 2 per share ex-dividend date: Sep-19-2008
Risk Adjusted Returns v/s
Returns Beta

News
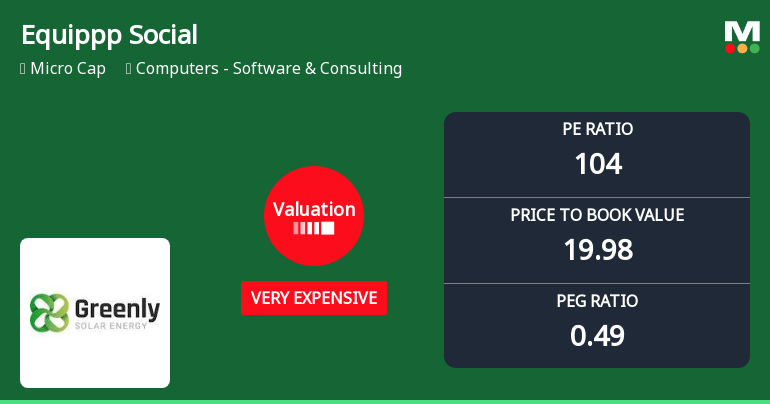
Equippp Social Impact Technologies Ltd Valuation Shifts to Very Expensive Amid Mixed Returns
Equippp Social Impact Technologies Ltd has seen a marked shift in its valuation parameters, moving from an expensive to a very expensive rating, driven by elevated price-to-earnings and price-to-book ratios. Despite this, the company’s recent returns have been mixed, with strong long-term gains contrasting with underperformance over the past year and year-to-date periods.
Read full news article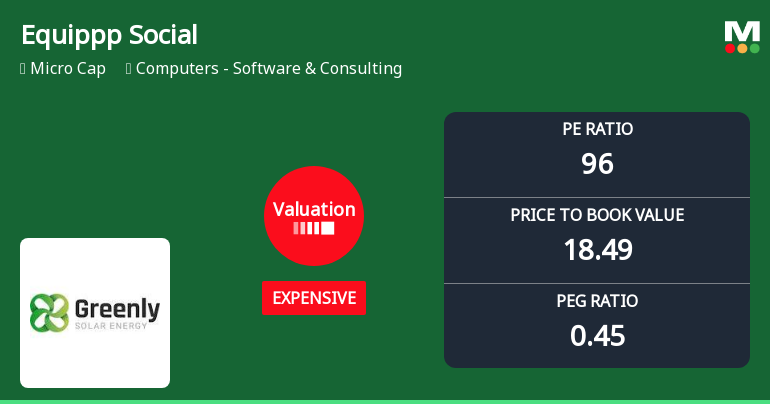
Equippp Social Impact Technologies Ltd: Valuation Shifts Signal Price Attractiveness Decline
Equippp Social Impact Technologies Ltd has recently undergone a notable shift in its valuation parameters, moving from a 'very expensive' to an 'expensive' rating. This change, coupled with a downgrade in its Mojo Grade from Hold to Sell, highlights growing concerns about the stock’s price attractiveness amid a challenging market backdrop and stretched valuation multiples.
Read full news article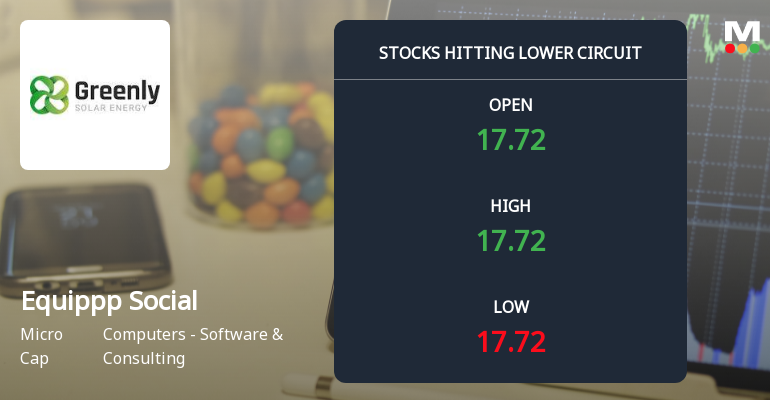
Equippp Social Impact Technologies Ltd Locks at Lower Circuit With 4.6% Loss — Sellers Queue, No Buyers in Sight
At Rs 16.94, sellers were still queuing — but no buyers stepped forward. Equippp Social Impact Technologies Ltd locked at its lower circuit of 5% on 3 Jun 2026, with unfilled supply forcing the price to freeze at the floor level.
Read full news article Announcements
Announcement under Regulation 30 (LODR)-Newspaper Publication
31-May-2026 | Source : BSEIntimation about news paper publication of financial results for the quarter and year ended 31.03.2026
Financial Results For The Quarter And Year Ended 31.03.2026
29-May-2026 | Source : BSEEquippp Social Impact Technologies Limited has informed the exchange about the Financial results for the quarter and year ended 31.03.2026
Board Meeting Outcome for Outcome Of The Board Meeting Dated 29.05.2026
29-May-2026 | Source : BSEOutcome of the Board meeting held on 29.05.2026
Corporate Actions

No Upcoming Board Meetings

Equippp Social Impact Technologies Ltd has declared 20% dividend, ex-date: 19 Sep 08

No Splits history available

Equippp Social Impact Technologies Ltd has announced 1:1 bonus issue, ex-date: 31 Aug 07

No Rights history available
Quality key factors
Valuation key factors
Technicals key factors
 Technical Indicator Scale: Bearish, Mildly Bearish, Sideways, Mildly Bullish, Bullish Turned
 Shareholding Snapshot : Mar 2026
Shareholding Compare (%holding)
Promoters
None
Held by 0 Schemes
Held by 0 FIIs
Equivas Capital Private Limited (77.86%)
None
11.53%
Quarterly Results Snapshot (Consolidated) - Mar'26 - QoQ

QoQ Growth in quarter ended Mar 2026 is 2.66% vs 10.96% in Dec 2025

QoQ Growth in quarter ended Mar 2026 is 169.44% vs 63.64% in Dec 2025
Half Yearly Results Snapshot (Consolidated) - Sep'25
Growth in half year ended Sep 2025 is 2,091.40% vs 0.00% in Sep 2024
Growth in half year ended Sep 2025 is 170.59% vs 23.60% in Sep 2024
Nine Monthly Results Snapshot (Consolidated) - Dec'25
YoY Growth in nine months ended Dec 2025 is 2,167.83% vs 361.29% in Dec 2024
YoY Growth in nine months ended Dec 2025 is 185.71% vs 3.92% in Dec 2024
Annual Results Snapshot (Consolidated) - Mar'26
YoY Growth in year ended Mar 2026 is 527.31% vs 281.82% in Mar 2025
YoY Growth in year ended Mar 2026 is 212.07% vs 307.14% in Mar 2025
About Equippp Social Impact Technologies Ltd

Company Coordinates


