
Compare Equitas Sma. Fin with Similar Stocks
Dashboard
Strong lending practices with low Gross NPA ratio of 2.60%
The Bank has a high Capital Adequacy Ratio of 20.81% signifying high buffers against its risk based assets
With a growth in Operating Profit of 31.02%, the company declared Very Positive results in Mar 26
High Institutional Holdings at 65.61%
Market Beating Performance
Total Returns (Price + Dividend) 
Latest dividend: 1 per share ex-dividend date: Aug-09-2024
Risk Adjusted Returns v/s
Returns Beta

News

Equitas Small Finance Bank Ltd is Rated Buy
Equitas Small Finance Bank Ltd is rated 'Buy' by MarketsMOJO, with this rating last updated on 30 April 2026. However, the analysis and financial metrics discussed here reflect the stock's current position as of 19 June 2026, providing investors with the latest insights into its performance and outlook.
Read full news article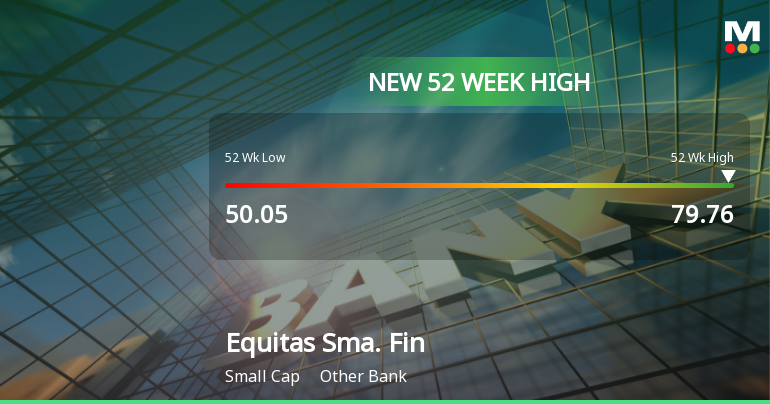
Broad-Based Technical Strength Lifts Equitas Small Finance Bank Ltd to 52-Week High of Rs 79.92
With a steady climb from Rs 50.05 to a fresh 52-week high of Rs 79.92 on 16 Jun 2026, Equitas Small Finance Bank Ltd has outpaced the broader market, delivering a 17.90% return over the past year against the Sensex’s decline of 6.29%. This milestone caps a three-day winning streak that has added 11.51% to the stock’s value, underscoring robust momentum driven by a confluence of technical indicators and positive market sentiment.
Read full news article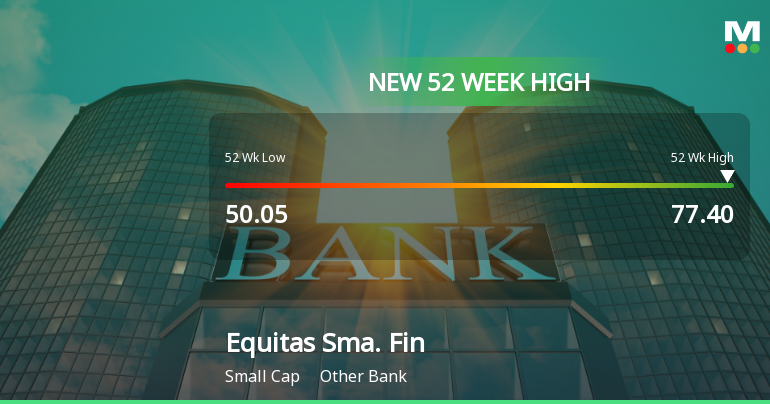
Broad-Based Technical Strength Lifts Equitas Small Finance Bank Ltd to 52-Week High of Rs 77.4
With a steady climb from Rs 50.05 to Rs 77.4 over the past year, Equitas Small Finance Bank Ltd has outpaced the broader market, delivering an 11.82% return against the Sensex’s decline of 5.52%. The stock’s recent surge to a fresh 52-week high on 15 Jun 2026 underscores a powerful momentum driven by a confluence of technical indicators and sustained price strength.
Read full news article Announcements
Board Meeting Intimation for Inter-Alia To Consider And Approve Fund Raising
19-Jun-2026 | Source : BSEEquitas Small Finance Bank Ltdhas informed BSE that the meeting of the Board of Directors of the Company is scheduled on 24/06/2026 inter alia to consider and approve fund raising
Announcement under Regulation 30 (LODR)-Press Release / Media Release
18-Jun-2026 | Source : BSEEquitas Small Finance Bank Limited has informed the Exchanges regarding Press release dated June 18 2026
Announcement under Regulation 30 (LODR)-Change in Management
17-Jun-2026 | Source : BSEEquitas Small Finance Bank Limited has informed the Exchanges regarding the change in Senior management personnel of the BanK
Corporate Actions

(24 Jun 2026)

Equitas Small Finance Bank Ltd has declared 10% dividend, ex-date: 09 Aug 24

No Splits history available

No Bonus history available

No Rights history available
Quality key factors
Valuation key factors
Technicals key factors
 Technical Indicator Scale: Bearish, Mildly Bearish, Sideways, Mildly Bullish, Bullish Turned
 Shareholding Snapshot : Mar 2026
Shareholding Compare (%holding)
Mutual Funds
None
Held by 26 Schemes (45.16%)
Held by 119 FIIs (14.74%)
None
Hdfc Mutual Fund (8.66%)
26.73%
Quarterly Results Snapshot (Standalone) - Mar'26 - QoQ

QoQ Growth in quarter ended Mar 2026 is 8.55% vs 4.6% in Dec 2025

QoQ Growth in quarter ended Mar 2026 is 136.23% vs 272.95% in Dec 2025
Half Yearly Results Snapshot (Standalone) - Sep'25
Growth in half year ended Sep 2025 is 6.88% vs 16.95% in Sep 2024
Growth in half year ended Sep 2025 is -616.64% vs -90.08% in Sep 2024
Nine Monthly Results Snapshot (Standalone) - Dec'25
YoY Growth in nine months ended Dec 2025 is 6.22% vs 15.49% in Dec 2024
YoY Growth in nine months ended Dec 2025 is -204.44% vs -82.25% in Dec 2024
Annual Results Snapshot (Standalone) - Mar'26
YoY Growth in year ended Mar 2026 is 7.64% vs 15.04% in Mar 2025
YoY Growth in year ended Mar 2026 is -29.90% vs -81.59% in Mar 2025
About Equitas Small Finance Bank Ltd

Company Coordinates


