
Compare Equitas Sma. Fin with Similar Stocks
Dashboard
Strong lending practices with low Gross NPA ratio of 2.60%
The Bank has a high Capital Adequacy Ratio of 20.81% signifying high buffers against its risk based assets
With a growth in Operating Profit of 31.02%, the company declared Very Positive results in Mar 26
High Institutional Holdings at 65.61%
Total Returns (Price + Dividend) 
Latest dividend: 1 per share ex-dividend date: Aug-09-2024
Risk Adjusted Returns v/s
Returns Beta

News

Equitas Small Finance Bank Ltd is Rated Buy
Equitas Small Finance Bank Ltd is rated Buy by MarketsMOJO, with this rating last updated on 30 April 2026. However, the analysis and financial metrics discussed here reflect the stock’s current position as of 14 May 2026, providing investors with an up-to-date view of its fundamentals, returns, and overall outlook.
Read full news article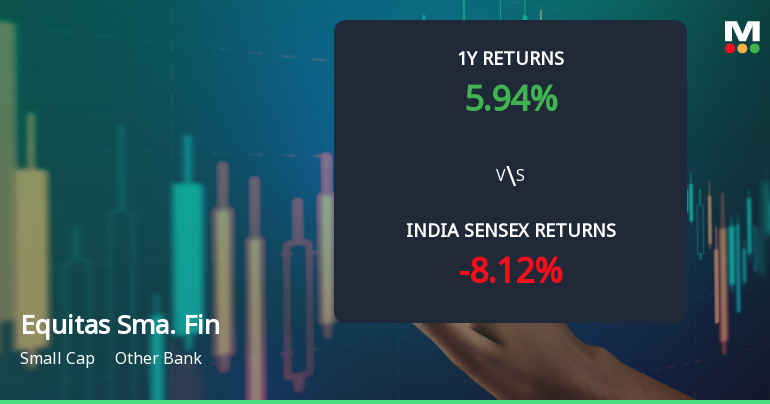
Equitas Small Finance Bank Ltd Technical Momentum Shifts Signal Bullish Outlook
Equitas Small Finance Bank Ltd has experienced a notable shift in its technical momentum, moving from a mildly bullish stance to a more confident bullish trend. Despite a recent day decline of 2.51%, the stock’s technical indicators reveal a complex interplay of signals that suggest potential upside, balanced by some cautionary signs. This analysis delves into the latest technical parameters, price action, and comparative returns to provide investors with a comprehensive view of the stock’s current market positioning.
Read full news article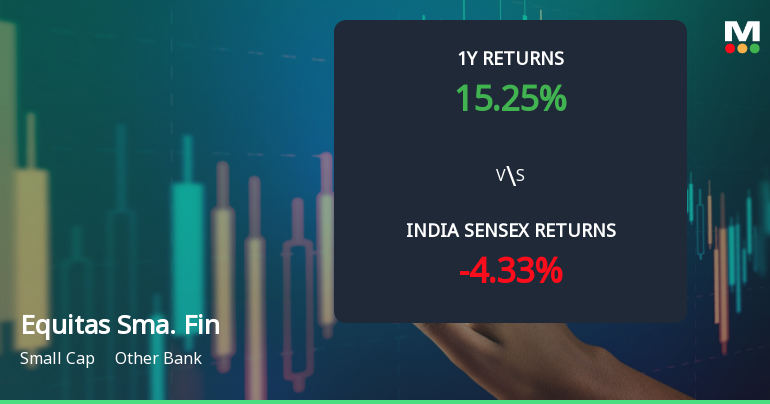
Equitas Small Finance Bank Ltd Technical Momentum Shifts Amid Mixed Market Signals
Equitas Small Finance Bank Ltd has experienced a nuanced shift in its technical momentum, moving from a bullish to a mildly bullish trend as of early May 2026. Despite a recent dip in share price, the bank’s technical indicators present a complex picture, with some metrics signalling strength while others suggest caution. This article analyses the latest technical parameters, price movements, and comparative returns to provide a comprehensive view for investors.
Read full news article Announcements
Corporate Actions

No Upcoming Board Meetings

Equitas Small Finance Bank Ltd has declared 10% dividend, ex-date: 09 Aug 24

No Splits history available

No Bonus history available

No Rights history available
Quality key factors
Valuation key factors
Technicals key factors
 Technical Indicator Scale: Bearish, Mildly Bearish, Sideways, Mildly Bullish, Bullish Turned
 Shareholding Snapshot : Mar 2026
Shareholding Compare (%holding)
Mutual Funds
None
Held by 26 Schemes (45.16%)
Held by 119 FIIs (14.74%)
None
Hdfc Mutual Fund (8.66%)
26.73%
Quarterly Results Snapshot (Standalone) - Mar'26 - QoQ

QoQ Growth in quarter ended Mar 2026 is 8.55% vs 4.6% in Dec 2025

QoQ Growth in quarter ended Mar 2026 is 136.23% vs 272.95% in Dec 2025
Half Yearly Results Snapshot (Standalone) - Sep'25
Growth in half year ended Sep 2025 is 6.88% vs 16.95% in Sep 2024
Growth in half year ended Sep 2025 is -616.64% vs -90.08% in Sep 2024
Nine Monthly Results Snapshot (Standalone) - Dec'25
YoY Growth in nine months ended Dec 2025 is 6.22% vs 15.49% in Dec 2024
YoY Growth in nine months ended Dec 2025 is -204.44% vs -82.25% in Dec 2024
Annual Results Snapshot (Standalone) - Mar'26
YoY Growth in year ended Mar 2026 is 7.64% vs 15.04% in Mar 2025
YoY Growth in year ended Mar 2026 is -29.90% vs -81.59% in Mar 2025
About Equitas Small Finance Bank Ltd

Company Coordinates


