
Compare Equitas Sma. Fin with Similar Stocks
Dashboard
Strong lending practices with low Gross NPA ratio of 2.60%
The Bank has a high Capital Adequacy Ratio of 20.81% signifying high buffers against its risk based assets
With a growth in Operating Profit of 31.02%, the company declared Very Positive results in Mar 26
High Institutional Holdings at 65.61%
Total Returns (Price + Dividend) 
Latest dividend: 1 per share ex-dividend date: Aug-09-2024
Risk Adjusted Returns v/s
Returns Beta

News
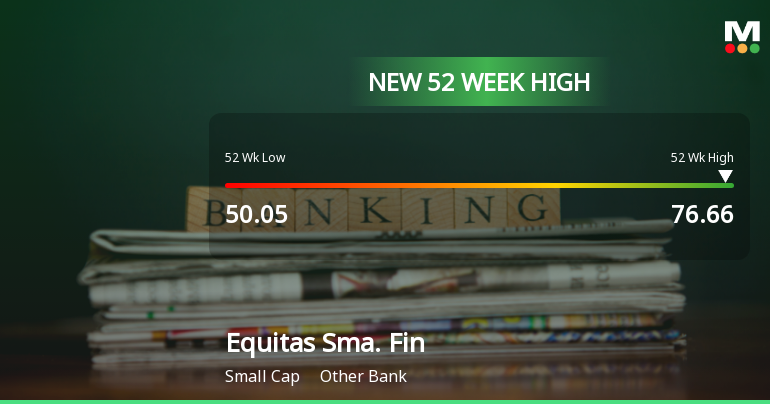
Broad-Based Technical Strength Lifts Equitas Small Finance Bank Ltd to 52-Week High of Rs 76.66
Surging past its previous peaks, Equitas Small Finance Bank Ltd touched a fresh 52-week high of Rs 76.66 on 09 Jun 2026, marking a notable milestone in its price momentum. This rally has been fuelled by a confluence of strong technical signals and sustained buying interest, even as broader market indices show signs of volatility.
Read full news article
Equitas Small Finance Bank Ltd is Rated Buy
Equitas Small Finance Bank Ltd is rated 'Buy' by MarketsMOJO, with this rating last updated on 30 April 2026. However, the analysis and financial metrics discussed here reflect the stock's current position as of 08 June 2026, providing investors with an up-to-date view of the company’s fundamentals, returns, and market performance.
Read full news article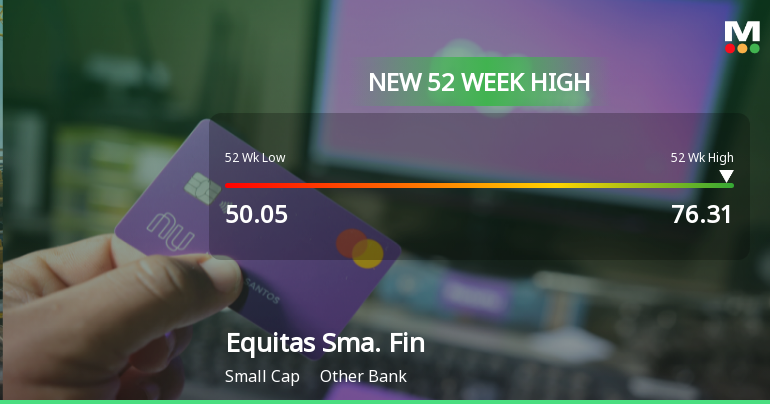
Broad-Based Technical Strength Lifts Equitas Small Finance Bank Ltd to 52-Week High of Rs 76.31
With a sustained five-day rally culminating in a fresh 52-week high of Rs 76.31 on 8 Jun 2026, Equitas Small Finance Bank Ltd has demonstrated robust price momentum that stands out amid a broadly subdued market backdrop.
Read full news article Announcements
Announcement under Regulation 30 (LODR)-Allotment of ESOP / ESPS
08-Jun-2026 | Source : BSEEquitas Small Finance Bank Limited has informed the Exchanges regarding the allotment of shares pursuant to exercise of ESOP
Disclosures under Reg. 29(1) of SEBI (SAST) Regulations 2011
06-Jun-2026 | Source : BSEThe Exchange has received the disclosure under Regulation 29(1) of SEBI (Substantial Acquisition of Shares & Takeovers) Regulations 2011 for Mirae Asset Mutual Fund
Schedule Of Analyst/Investor Meet
05-Jun-2026 | Source : BSEEquitas Small Finance Bank Limited has informed the Exchanges regarding the Schedule of Analyst/Investor meet
Corporate Actions

No Upcoming Board Meetings

Equitas Small Finance Bank Ltd has declared 10% dividend, ex-date: 09 Aug 24

No Splits history available

No Bonus history available

No Rights history available
Quality key factors
Valuation key factors
Technicals key factors
 Technical Indicator Scale: Bearish, Mildly Bearish, Sideways, Mildly Bullish, Bullish Turned
 Shareholding Snapshot : Mar 2026
Shareholding Compare (%holding)
Mutual Funds
None
Held by 26 Schemes (45.16%)
Held by 119 FIIs (14.74%)
None
Hdfc Mutual Fund (8.66%)
26.73%
Quarterly Results Snapshot (Standalone) - Mar'26 - QoQ

QoQ Growth in quarter ended Mar 2026 is 8.55% vs 4.6% in Dec 2025

QoQ Growth in quarter ended Mar 2026 is 136.23% vs 272.95% in Dec 2025
Half Yearly Results Snapshot (Standalone) - Sep'25
Growth in half year ended Sep 2025 is 6.88% vs 16.95% in Sep 2024
Growth in half year ended Sep 2025 is -616.64% vs -90.08% in Sep 2024
Nine Monthly Results Snapshot (Standalone) - Dec'25
YoY Growth in nine months ended Dec 2025 is 6.22% vs 15.49% in Dec 2024
YoY Growth in nine months ended Dec 2025 is -204.44% vs -82.25% in Dec 2024
Annual Results Snapshot (Standalone) - Mar'26
YoY Growth in year ended Mar 2026 is 7.64% vs 15.04% in Mar 2025
YoY Growth in year ended Mar 2026 is -29.90% vs -81.59% in Mar 2025
About Equitas Small Finance Bank Ltd

Company Coordinates


