
Compare Esab India with Similar Stocks
Dashboard
Strong Long Term Fundamental Strength with an average Return on Equity (ROE) of 46.66%
- Healthy long term growth as Operating profit has grown by an annual rate 29.37%
- The company is Net-Debt Free
Flat results in Mar 26
With ROE of 44.8, it has a Very Expensive valuation with a 20.1 Price to Book Value
Majority shareholders : Promoters
Market Beating performance in long term as well as near term
Stock DNA
Other Industrial Products
INR 8,596 Cr (Small Cap)
45.00
40
1.64%
-0.26
44.84%
20.09
Total Returns (Price + Dividend) 
Latest dividend: 25 per share ex-dividend date: Feb-13-2026
Risk Adjusted Returns v/s
Returns Beta

News

Esab India Ltd Downgraded to Hold Amid Mixed Technicals and Valuation Concerns
Esab India Ltd, a prominent player in the Electrodes & Welding Equipment sector, has seen its investment rating downgraded from Buy to Hold as of 3 June 2026. This revision reflects a nuanced assessment across four critical parameters: Quality, Valuation, Financial Trend, and Technicals. While the company maintains strong long-term fundamentals, recent flat quarterly results and evolving technical indicators have tempered enthusiasm among analysts.
Read full news article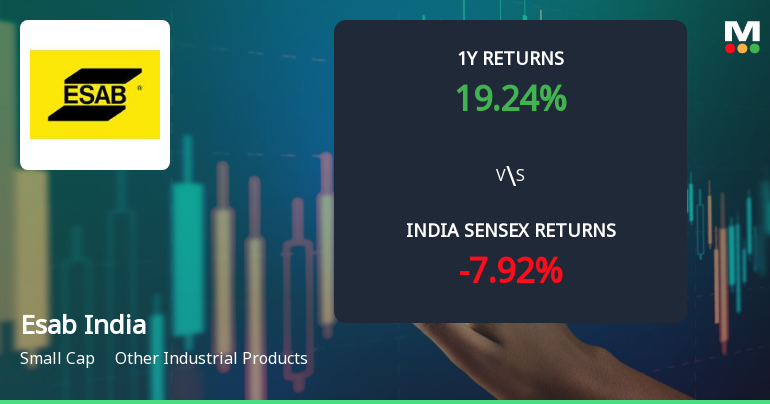
Esab India Ltd Technical Momentum Shifts Amid Mixed Market Signals
Esab India Ltd, a small-cap player in the Other Industrial Products sector, has experienced a notable shift in its technical momentum, moving from a bullish to a mildly bullish stance. Despite a recent decline in price, key technical indicators such as MACD and KST maintain bullish signals on weekly and monthly charts, while moving averages and Bollinger Bands suggest a cautiously optimistic outlook. This article analyses the evolving technical landscape and what it means for investors amid a backdrop of mixed market signals.
Read full news article
Esab India Ltd is Rated Buy
Esab India Ltd is rated 'Buy' by MarketsMOJO, with this rating last updated on 17 April 2026. However, the analysis and financial metrics presented here reflect the stock's current position as of 03 June 2026, providing investors with the most recent and relevant data to assess the company's prospects.
Read full news article Announcements
Compliances-Reg.24(A)-Annual Secretarial Compliance
21-May-2026 | Source : BSEPlease find attached the Annual Secretarial Compliance report for the FY 2025-26
Announcement under Regulation 30 (LODR)-Cessation
30-Apr-2026 | Source : BSEIn pursuance of regulation 30 and Para A of Part A of Schedule III of SEBI LODR Regulations 2015 we wish to inform you that ESAB Holdings Limited vide its letter dated 22nd April 2026 has withdrawn its nomination of Kevin Johnson DIN: 09147729 as a nominee director on the board of directors with effect from 1st may 2026. in view of this Mr. Kevin johnson resigned from the board of ESAB India Limited from 1st May 2026. The meeting of the board of directors commenced at 17:09 hours and concluded at 17:30 hours. We request you to take this on record and inform the members of the exchange regarding this.
: Disclosure Under Regulation 30 Read With Schedule III Of The SEBI (Listing Obligations And Disclosure Requirements) Regulations 2015 (Listing Regulations)
30-Apr-2026 | Source : BSEWe hereby inform you that the company has received an order dated 30th April 2026 from Deputy commissioner of Revenue State Tax Office of the Senior Joint Commissioner Commercial Taxes West Bengal.
Corporate Actions

No Upcoming Board Meetings

Esab India Ltd has declared 250% dividend, ex-date: 23 Jul 26

No Splits history available

No Bonus history available

No Rights history available
Quality key factors
Valuation key factors
Technicals key factors
 Technical Indicator Scale: Bearish, Mildly Bearish, Sideways, Mildly Bullish, Bullish Turned
 Shareholding Snapshot : Mar 2026
Shareholding Compare (%holding)
Promoters
None
Held by 8 Schemes (12.7%)
Held by 68 FIIs (1.55%)
Esab Holdings Limited (37.31%)
Sbi Retirement Benefit Fund- Conservative Plan (9.64%)
9.69%
Quarterly Results Snapshot (Standalone) - Mar'26 - YoY

YoY Growth in quarter ended Mar 2026 is 7.62% vs 7.86% in Mar 2025
YoY Growth in quarter ended Mar 2026 is -8.18% vs 7.19% in Mar 2025
Half Yearly Results Snapshot (Standalone) - Sep'25
Growth in half year ended Sep 2025 is 9.77% vs 11.12% in Sep 2024

Growth in half year ended Sep 2025 is 37.13% vs 8.44% in Sep 2024
Nine Monthly Results Snapshot (Standalone) - Dec'25
YoY Growth in nine months ended Dec 2025 is 10.60% vs 11.40% in Dec 2024
YoY Growth in nine months ended Dec 2025 is 27.46% vs 7.79% in Dec 2024
Annual Results Snapshot (Standalone) - Mar'26
YoY Growth in year ended Mar 2026 is 9.81% vs 10.47% in Mar 2025
YoY Growth in year ended Mar 2026 is 17.83% vs 7.63% in Mar 2025
About Esab India Ltd

Company Coordinates


