
Compare Escorts Kubota with Similar Stocks
Stock DNA
Automobiles
INR 33,093 Cr (Mid Cap)
20.00
21
1.75%
-0.55
12.95%
2.64
Total Returns (Price + Dividend) 
Latest dividend: 32.94444444444444 per share ex-dividend date: Jul-03-2026
Risk Adjusted Returns v/s
Returns Beta

News

Escorts Kubota Ltd is Rated Sell
Escorts Kubota Ltd is rated Sell by MarketsMOJO, with this rating last updated on 04 May 2026. However, the analysis and financial metrics discussed here reflect the stock’s current position as of 22 July 2026, providing investors with an up-to-date view of the company’s fundamentals, returns, and market performance.
Read full news article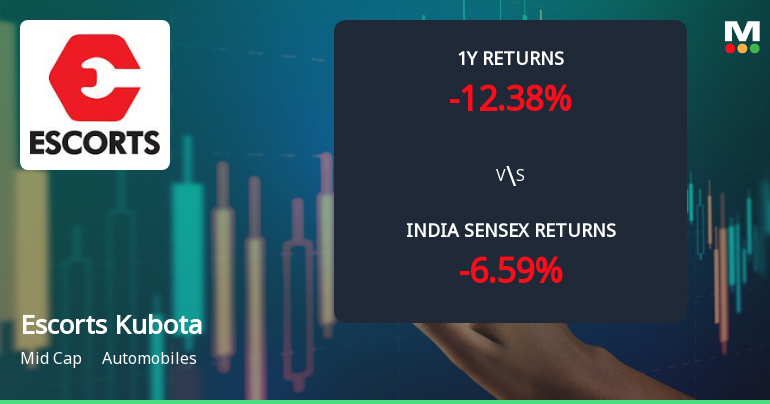
Escorts Kubota Ltd Technical Momentum Shifts Amid Mixed Market Signals
Escorts Kubota Ltd has experienced a subtle shift in its technical momentum, moving from a bearish to a mildly bearish trend, as reflected in recent indicator readings. Despite a modest day gain of 0.79%, the stock’s technical landscape presents a complex picture with mixed signals from MACD, RSI, Bollinger Bands, and moving averages, warranting a nuanced analysis for investors navigating the automobile sector.
Read full news article
Escorts Kubota Ltd Faces Bearish Technical Shift Amid Mixed Momentum Signals
Escorts Kubota Ltd has experienced a notable shift in its technical momentum, with key indicators signalling a transition from mildly bearish to bearish trends. Despite a modest decline in the stock price, the broader technical landscape reveals mixed signals across weekly and monthly timeframes, prompting a cautious outlook for investors in this mid-cap automobile sector player.
Read full news article Announcements
Escorts Limited - Credit Rating
09-Dec-2019 | Source : NSEEscorts Limited has informed the Exchange regarding Credit Rating by Crisil
Escorts Limited - Resignation
28-Nov-2019 | Source : NSEEscorts Limited has informed the Exchange regarding Resignation of Mr D J Kakalia as Independent Director of the company w.e.f. November 27, 2019.
Escorts Limited - Press Release
13-Nov-2019 | Source : NSEEscorts Limited has informed the Exchange regarding a press release dated November 11, 2019, titled "Farmtrac unveils Hybrid Concept Tractor at Agritechnica 2019".
Corporate Actions

03 Aug 2026

Escorts Kubota Ltd has declared 330% dividend, ex-date: 03 Jul 26

No Splits history available

No Bonus history available

No Rights history available
Quality key factors
Valuation key factors
Technicals key factors
 Technical Indicator Scale: Bearish, Mildly Bearish, Sideways, Mildly Bullish, Bullish Turned
 Shareholding Snapshot : Jun 2026
Shareholding Compare (%holding)
Promoters
None
Held by 31 Schemes (9.49%)
Held by 196 FIIs (6.36%)
Kubota Corporation, Japan (54.07%)
Hdfc Mutual Fund - Hdfc Nifty Large Midcap 250 Ind (6.94%)
10.9%
Quarterly Results Snapshot (Consolidated) - Mar'26 - QoQ

QoQ Growth in quarter ended Mar 2026 is -9.52% vs 17.51% in Dec 2025
QoQ Growth in quarter ended Mar 2026 is -10.54% vs 12.61% in Dec 2025
Half Yearly Results Snapshot (Consolidated) - Sep'25

Growth in half year ended Sep 2025 is 9.08% vs -8.60% in Sep 2024
Growth in half year ended Sep 2025 is 174.06% vs 23.17% in Sep 2024
Nine Monthly Results Snapshot (Consolidated) - Dec'25
YoY Growth in nine months ended Dec 2025 is 9.91% vs -2.94% in Dec 2024
YoY Growth in nine months ended Dec 2025 is 119.07% vs 17.34% in Dec 2024
Annual Results Snapshot (Consolidated) - Mar'26
YoY Growth in year ended Mar 2026 is 12.66% vs 4.49% in Mar 2025
YoY Growth in year ended Mar 2026 is 89.27% vs 17.49% in Mar 2025
About Escorts Kubota Ltd

Company Coordinates


