
Compare Eureka Forbes with Similar Stocks
Dashboard
Poor Management Efficiency with a low ROE of 2.96%
- The company has been able to generate a Return on Equity (avg) of 2.96% signifying low profitability per unit of shareholders funds
Flat results in Mar 26
53.66% of Promoter Shares are Pledged
Below par performance in long term as well as near term
Stock DNA
Electronics & Appliances
INR 8,888 Cr (Small Cap)
47.00
54
0.00%
-0.10
4.18%
1.94
Total Returns (Price + Dividend) 
Eureka Forbes for the last several years.
Risk Adjusted Returns v/s
Returns Beta

News

Eureka Forbes Ltd is Rated Sell
Eureka Forbes Ltd is rated 'Sell' by MarketsMOJO, with this rating last updated on 18 May 2026. However, the analysis and financial metrics presented here reflect the stock's current position as of 21 June 2026, providing investors with an up-to-date view of the company’s fundamentals, returns, and market performance.
Read full news article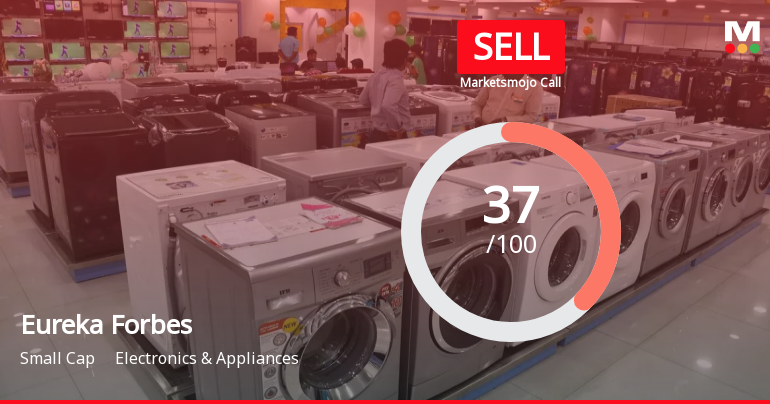
Eureka Forbes Ltd is Rated Sell
Eureka Forbes Ltd is rated 'Sell' by MarketsMOJO, with this rating last updated on 18 May 2026. However, the analysis and financial metrics discussed here reflect the stock's current position as of 10 June 2026, providing investors with an up-to-date view of the company’s fundamentals, valuation, financial trend, and technical outlook.
Read full news article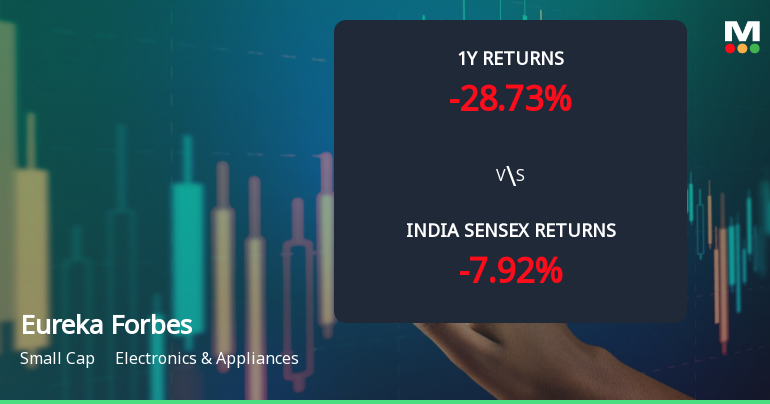
Eureka Forbes Ltd Faces Bearish Momentum Amid Technical Downgrade
Eureka Forbes Ltd has experienced a notable shift in its technical momentum, with key indicators signalling a transition from mildly bearish to a more pronounced bearish trend. The stock’s recent price action, combined with mixed signals from MACD, RSI, and moving averages, suggests increasing downside pressure amid a challenging market environment for the electronics and appliances sector.
Read full news article Announcements
Intimation Of Schedule Of Analyst/Institutional Investor Meeting Under Regulation 30 Of SEBI LODR
17-Jun-2026 | Source : BSEPlease find attached
Announcement under Regulation 30 (LODR)-Allotment of ESOP / ESPS
16-Jun-2026 | Source : BSEPursuant to above the Company wishes to inform that it has allotted securities pursuant to exercise of options granted
Intimation Of Schedule Of Analyst/Institutional Investor Meeting Under Regulation 30 Of SEBI LODR
15-Jun-2026 | Source : BSEPlease find attached
Corporate Actions

No Upcoming Board Meetings

No Dividend history available

No Splits history available

No Bonus history available

No Rights history available
Quality key factors
Valuation key factors
Technicals key factors
 Technical Indicator Scale: Bearish, Mildly Bearish, Sideways, Mildly Bullish, Bullish Turned
 Shareholding Snapshot : Mar 2026
Shareholding Compare (%holding)
Promoters
53.6592
Held by 14 Schemes (4.67%)
Held by 127 FIIs (13.66%)
Lunolux Limited (62.56%)
Hill Fort India Fund Lp (2.05%)
11.55%
Quarterly Results Snapshot (Consolidated) - Mar'26 - QoQ

QoQ Growth in quarter ended Mar 2026 is 5.94% vs -16.41% in Dec 2025
QoQ Growth in quarter ended Mar 2026 is 409.28% vs -84.07% in Dec 2025
Half Yearly Results Snapshot (Consolidated) - Sep'25
Growth in half year ended Sep 2025 is 12.51% vs 11.88% in Sep 2024

Growth in half year ended Sep 2025 is 27.20% vs 55.73% in Sep 2024
Nine Monthly Results Snapshot (Consolidated) - Dec'25
YoY Growth in nine months ended Dec 2025 is 11.02% vs 11.53% in Dec 2024
YoY Growth in nine months ended Dec 2025 is -2.88% vs 54.76% in Dec 2024
Annual Results Snapshot (Consolidated) - Mar'26
YoY Growth in year ended Mar 2026 is 11.17% vs 11.31% in Mar 2025
YoY Growth in year ended Mar 2026 is -1.08% vs 71.89% in Mar 2025
About Eureka Forbes Ltd

Company Coordinates


