


Key Events This Week
18 May: Technical momentum shifts to sideways amid mixed market signals
19 May: Q4 FY26 results reveal strong recovery but margin pressures persist
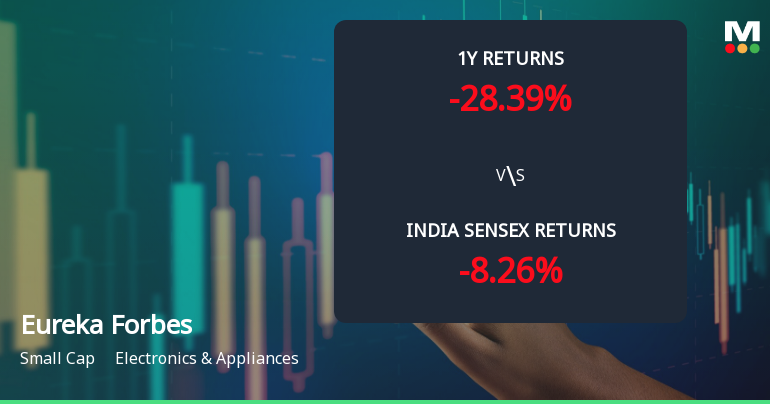
19 May: Downgrade to Sell rating amid technical weakness and flat financials
19 May: Technical setbacks deepen as price momentum turns mildly bearish
Are Eureka Forbes Ltd latest results good or bad?
2026-05-20 19:25:01Eureka Forbes Ltd reported its financial results for Q4 FY26, showcasing a significant quarter-on-quarter recovery in net profit, which reached ₹51.03 crore, a notable change from the previous quarter. This recovery was largely attributed to a rebound from an exceptionally weak Q3 FY26, where net profit had experienced a substantial decline. However, when viewed year-on-year, the profit growth was modest at just 3.09%, which raises concerns given that revenue growth was more robust at 11.60%. The company's revenue for Q4 FY26 stood at ₹683.72 crore, reflecting a 5.94% increase from the previous quarter and an 11.60% rise compared to the same quarter last year. This sustained revenue growth indicates the company's ability to capture market share within the competitive home appliances sector, particularly in water purification and vacuum cleaning systems. Despite the positive revenue figures, the operating ...
Read full news article


