
Compare Euro Pratik Sale with Similar Stocks
Dashboard
High Management Efficiency with a high ROE of 0%
The company is Net-Debt Free
Poor long term growth as Operating profit has grown by an annual rate 0% of over the last 5 years
Flat results in Mar 26
With ROE of 26.8, it has a Very Expensive valuation with a 10.2 Price to Book Value
Falling Participation by Institutional Investors
Stock DNA
Furniture, Home Furnishing
INR 3,222 Cr (Small Cap)
38.00
NA
0.06%
-0.03
26.76%
10.23
Total Returns (Price + Dividend) 
Latest dividend: 0.1976911348290133 per share ex-dividend date: Mar-27-2026
Risk Adjusted Returns v/s
Returns Beta

News

Euro Pratik Sales Ltd Surges 8.68% to Day's High of Rs 321.3 — Outperforms Sector by 5.99 Percentage Points
The Sensex advanced 0.61% on 3 Jul 2026, yet Euro Pratik Sales Ltd outpaced the broader market with an 8.68% gain, touching an intraday high of Rs 321.3. This 5.99-percentage-point outperformance over its Furniture, Home Furnishing sector peers signals a distinctly stock-specific rally rather than a market-wide lift.
Read full news article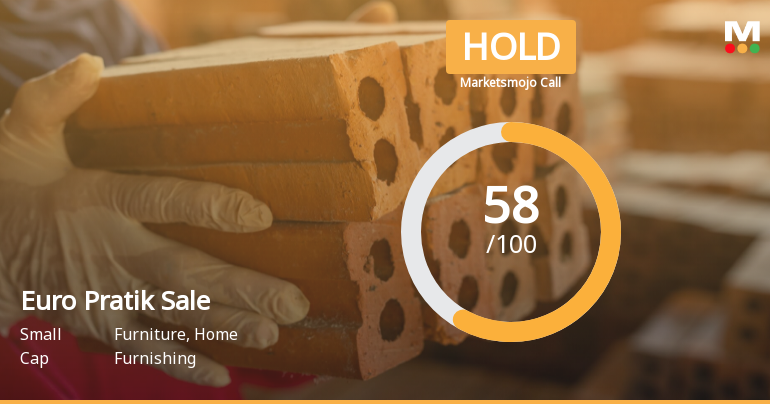
Euro Pratik Sales Ltd is Rated Hold by MarketsMOJO
Euro Pratik Sales Ltd is rated 'Hold' by MarketsMOJO, with this rating last updated on 04 May 2026. However, the analysis and financial metrics discussed here reflect the company’s current position as of 03 July 2026, providing investors with the most up-to-date view of the stock’s fundamentals, returns, and technical outlook.
Read full news article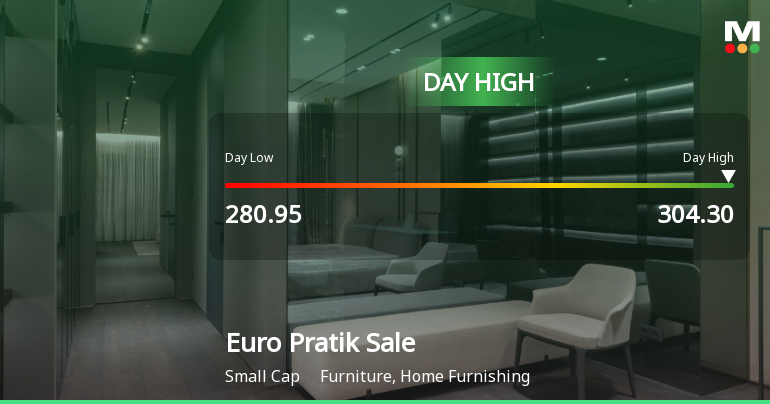
Euro Pratik Sales Ltd Surges 8.11% to Day's High of Rs 304.3 — Outperforms Sector by 8.74 Percentage Points
The Sensex rose 0.58% on 01 Jul 2026, yet Euro Pratik Sales Ltd outpaced the broader market with an 8.11% gain, reaching an intraday high of Rs 304.3. This 8.74-percentage-point outperformance over its Furniture, Home Furnishing sector peers signals a distinctly stock-specific rally rather than a market-wide lift.
Read full news article Announcements
Corporate Actions

No Upcoming Board Meetings

Euro Pratik Sales Ltd has declared 20% dividend, ex-date: 27 Mar 26

No Splits history available

No Bonus history available

No Rights history available
Quality key factors
Valuation key factors
Technicals key factors
 Technical Indicator Scale: Bearish, Mildly Bearish, Sideways, Mildly Bullish, Bullish Turned
 Shareholding Snapshot : Mar 2026
Shareholding Compare (%holding)
Promoters
None
Held by 2 Schemes (1.12%)
Held by 7 FIIs (0.49%)
Jai Gunwantraj Singhvi (22.68%)
Prakash Suresh Rita (3.55%)
21.11%
Quarterly Results Snapshot (Standalone) - Mar'26 - QoQ

QoQ Growth in quarter ended Mar 2026 is -5.16% vs -20.64% in Dec 2025
QoQ Growth in quarter ended Mar 2026 is -7.27% vs -9.94% in Dec 2025
Half Yearly Results Snapshot (Standalone) - Sep'25
Not Applicable: The company has declared_date for only one period
Not Applicable: The company has declared_date for only one period
Nine Monthly Results Snapshot (Standalone) - Dec'25
Not Applicable: The company has declared_date for only one period
Not Applicable: The company has declared_date for only one period
Annual Results Snapshot (Consolidated) - Mar'26

YoY Growth in year ended Mar 2026 is 17.85% vs 28.20% in Mar 2025
YoY Growth in year ended Mar 2026 is 1.47% vs 20.76% in Mar 2025
About Euro Pratik Sales Ltd

Company Coordinates


