
Compare Eurotex Industri with Similar Stocks
Dashboard
With a Negative Book Value, the company has a Weak Long Term Fundamental Strength
- Poor long term growth as Net Sales has grown by an annual rate of -65.84% and Operating profit at 0% over the last 5 years
- The company has a negative book value of Rs 27.45 crore
Flat results in Mar 26
Risky - Negative EBITDA
Stock DNA
Garments & Apparels
INR 14 Cr (Micro Cap)
NA (Loss Making)
52
0.00%
-1.29
2.88%
-0.50
Total Returns (Price + Dividend) 
Latest dividend: 0.5000 per share ex-dividend date: Aug-21-2014
Risk Adjusted Returns v/s
Returns Beta

News
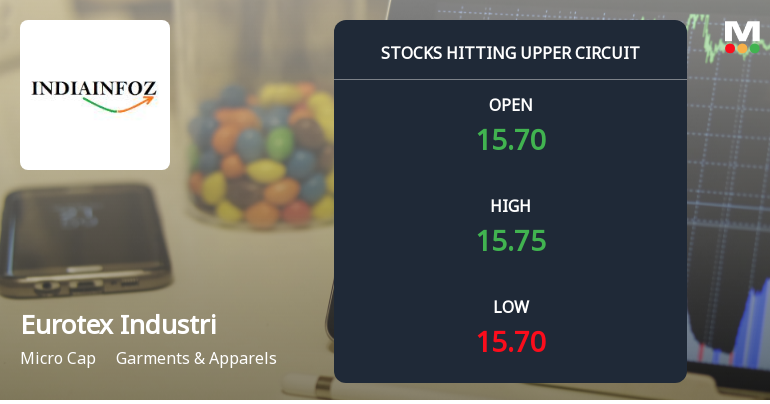
Eurotex Industries and Exports Ltd Locks at Upper Circuit With 4.94% Gain — Buyers Queue, Sellers Absent
At Rs 16.17, the buying was done — not because demand dried up, but because the exchange wouldn't let the stock go any higher. Eurotex Industries and Exports Ltd locked at its upper circuit of 4.94% on 3 Jul 2026, with buyers queuing and no sellers willing to part with shares.
Read full news article
Eurotex Industries and Exports Ltd Locks at Lower Circuit With 4.95% Loss — Sellers Queue, No Buyers in Sight
At Rs 15.35, Eurotex Industries and Exports Ltd locked at its lower circuit on 2 Jul 2026, marking a 4.95% decline within a 5% price band. Despite sellers lining up to exit, there were no buyers willing to absorb the supply, resulting in a freeze at the floor price and unfilled sell orders.
Read full news article
Eurotex Industries and Exports Ltd Locks at Lower Circuit With 4.93% Loss — Sellers Queue, No Buyers in Sight
At Rs 15.43, Eurotex Industries and Exports Ltd locked at its lower circuit on 1 Jul 2026, shedding 4.93% in a single session. Sellers were lined up at the floor price, but buyers were absent, resulting in unfilled supply and a frozen price for the day.
Read full news article Announcements
Closure of Trading Window
24-Jun-2026 | Source : BSEThe Trading Window will be closed from Wednesday 01st July 2026 till 48 hours after the declaration of Unaudited Financial Results of the Company for the Quarter ended 30th June 2026.
Announcement under Regulation 30 (LODR)-Change in Management
09-Jun-2026 | Source : BSEDemise of Shri. Hariprasad Siotia Non-Executive Director (DIN:00015103) of the Company
Compliances-Reg.24(A)-Annual Secretarial Compliance
26-May-2026 | Source : BSEPlease find enclosed the Annual Secretarial Compliance Report issued by M/s Aabid & Co. Practicing Company Secreatry for the Financial Year 2025-26.
Corporate Actions

No Upcoming Board Meetings

Eurotex Industries and Exports Ltd has declared 5% dividend, ex-date: 21 Aug 14

No Splits history available

No Bonus history available

No Rights history available
Quality key factors
Valuation key factors
Technicals key factors
 Technical Indicator Scale: Bearish, Mildly Bearish, Sideways, Mildly Bullish, Bullish Turned
 Shareholding Snapshot : Mar 2026
Shareholding Compare (%holding)
Promoters
None
Held by 1 Schemes (0.01%)
Held by 0 FIIs
Patodia Syntex Limited (43.37%)
Raviraj Developers Ltd (1.44%)
20.23%
Quarterly Results Snapshot (Standalone) - Mar'26 - QoQ
QoQ Growth in quarter ended Mar 2026 is -50.00% vs -50.00% in Dec 2025

QoQ Growth in quarter ended Mar 2026 is 9.71% vs -150.49% in Dec 2025
Half Yearly Results Snapshot (Standalone) - Sep'25

Growth in half year ended Sep 2025 is -87.69% vs 0.00% in Sep 2024
Growth in half year ended Sep 2025 is 144.32% vs 27.07% in Sep 2024
Nine Monthly Results Snapshot (Standalone) - Dec'25
YoY Growth in nine months ended Dec 2025 is -84.62% vs 0.00% in Dec 2024
YoY Growth in nine months ended Dec 2025 is 104.11% vs 38.89% in Dec 2024
Annual Results Snapshot (Standalone) - Mar'26
YoY Growth in year ended Mar 2026 is -90.52% vs 84.13% in Mar 2025
YoY Growth in year ended Mar 2026 is 54.60% vs 73.35% in Mar 2025
About Eurotex Industries and Exports Ltd

Company Coordinates


