
 Price Point
Compare Eveready Inds. with Similar Stocks


 Total Returns
Total Returns (Price + Dividend) 
Latest dividend: 2.489122807017544 per share ex-dividend date: Aug-04-2026
Risk Adjusted Returns v/s
Returns Beta
 News & Corporate Actions
News
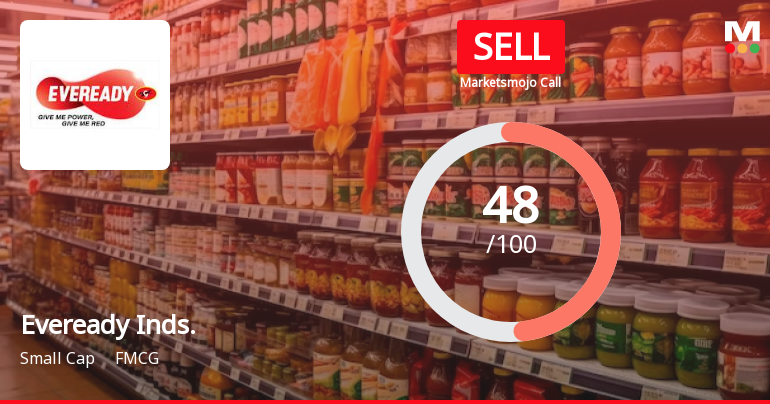
Eveready Industries India Ltd Downgraded to Sell Amid Technical Weakness and Long-Term Underperformance
Eveready Industries India Ltd, a small-cap player in the FMCG sector, has seen its investment rating downgraded from Hold to Sell as of 31 August 2026. This revision reflects a combination of deteriorating technical indicators, subdued long-term financial growth, and persistent underperformance relative to benchmark indices, despite some recent positive quarterly results. The company’s current Mojo Score stands at 48.0, with a Mojo Grade of Sell, signalling caution for investors.
Read full news article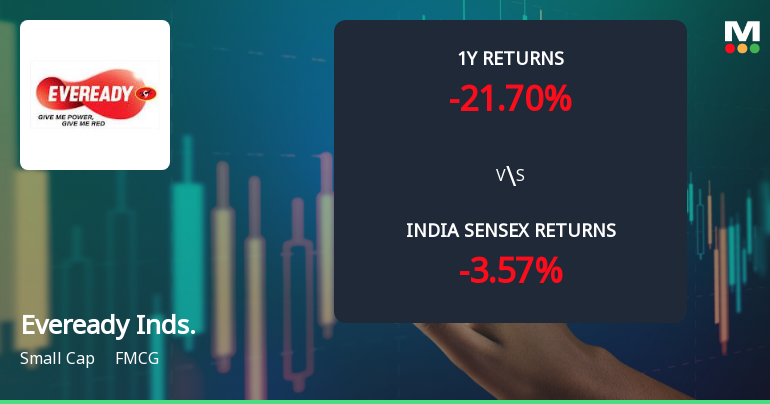
Eveready Industries India Ltd Faces Mildly Bearish Momentum Amid Technical Downgrade
Eveready Industries India Ltd (NSE: 448733), a small-cap player in the FMCG sector, has experienced a notable shift in its technical momentum, moving from a sideways trend to a mildly bearish stance. This transition is underscored by a combination of mixed signals from key technical indicators such as MACD, RSI, Bollinger Bands, and moving averages, reflecting a complex market sentiment as the stock trades near ₹330, down 2.14% on 1 September 2026.
Read full news article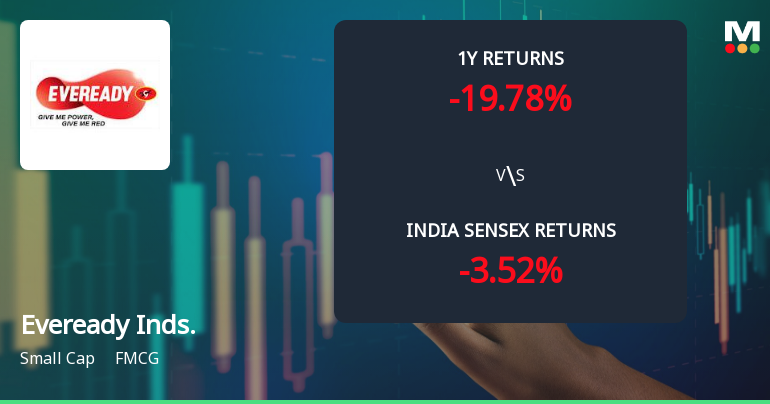
Eveready Industries India Ltd Technical Momentum Shifts Amid Mixed Market Signals
Eveready Industries India Ltd, a small-cap player in the FMCG sector, has experienced a notable shift in its technical momentum, moving from a mildly bullish stance to a sideways trend. This change is underscored by a complex interplay of technical indicators, including MACD, RSI, Bollinger Bands, and moving averages, signalling a nuanced outlook for investors as the stock navigates volatile market conditions.
Read full news article Announcements
Eveready Industries India Limited - Updates
14-Nov-2019 | Source : NSEEveready Industries India Limited has informed the Exchange regarding 'Pursuant to the provisrons of Regulation 47 of the SEBI (Listing Obligations and Disclosure Requirements), Regulations, 2015, and further to our letter of November 12, 2019, we enclose a copy of
Eveready Industries India Limited - Limited Review Report
13-Nov-2019 | Source : NSEEveready Industries India Limited has informed the Exchange regarding Limited Review Report for the Quarter ended September 30, 2019
Eveready Industries India Limited - Updates
06-Nov-2019 | Source : NSEEveready Industries India Limited has informed the Exchange regarding 'Pursuant to the provisions of Regulation 47 of the SEBI (Listing Obligations and Disclosure Requirements), Regulations, 2015 and further to our letter of November 04, 2019 we enclose a copy of the advertisement which was published in Financial Express and Aajkaal on Tuesday, November 05,2019.'.
Corporate Actions

No Upcoming Board Meetings

Eveready Industries India Ltd has declared 50% dividend, ex-date: 04 Aug 26

No Splits history available

No Bonus history available

No Rights history available
Key FactorsQuality key factors
Valuation key factors
Technicals key factors
 Technical Indicator Scale: Bearish, Mildly Bearish, Sideways, Mildly Bullish, Bullish Turned Shareholding
Shareholding Snapshot : Jun 2026
Shareholding Compare (%holding)
Non Institution
6.9886
Held by 5 Schemes (2.67%)
Held by 38 FIIs (5.44%)
M B Finmart Private Limited (11.81%)
Theleme India Master Fund Limited (4.31%)
21.23%
FinancialQuarterly Results Snapshot (Consolidated) - Jun'26 - YoY
 Compare with Peers
YoY Growth in quarter ended Jun 2026 is 8.97% vs 7.09% in Jun 2025
YoY Growth in quarter ended Jun 2026 is 22.30% vs 2.96% in Jun 2025

Half Yearly Results Snapshot (Consolidated) - Sep'25
Growth in half year ended Sep 2025 is 6.87% vs -2.26% in Sep 2024

Growth in half year ended Sep 2025 is -62.12% vs 17.14% in Sep 2024
Nine Monthly Results Snapshot (Consolidated) - Dec'25
YoY Growth in nine months ended Dec 2025 is 7.91% vs 1.17% in Dec 2024
YoY Growth in nine months ended Dec 2025 is -58.66% vs 22.67% in Dec 2024
Annual Results Snapshot (Consolidated) - Mar'26
YoY Growth in year ended Mar 2026 is 8.25% vs 2.30% in Mar 2025
YoY Growth in year ended Mar 2026 is 108.07% vs 23.49% in Mar 2025
 Company CV
About Eveready Industries India Ltd

Company Coordinates










