
 Price Point
Compare Vadilal Inds. with Similar Stocks
ScoreDashboard
Strong ability to service debt as the company has a low Debt to EBITDA ratio of 0.93 times
Healthy long term growth as Operating profit has grown by an annual rate 41.95%
With a growth in Net Profit of 95.45%, the company declared Outstanding results in Jun 26
With ROCE of 19.5, it has a Attractive valuation with a 5.6 Enterprise value to Capital Employed
Increasing Participation by Institutional Investors


 Total Returns
Total Returns (Price + Dividend) 
Latest dividend: 17.000573615057057 per share ex-dividend date: Aug-21-2026
Risk Adjusted Returns v/s
Returns Beta
 News & Corporate Actions
News
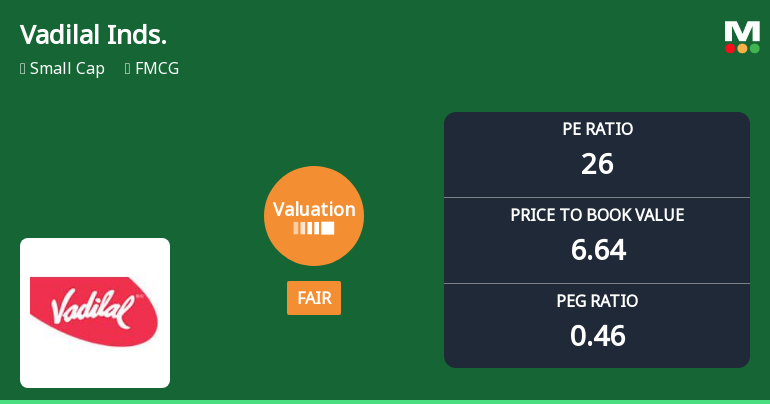
Vadilal Industries Ltd Valuation Shifts to Fair Amid Strong Market Performance
Vadilal Industries Ltd, a prominent player in the FMCG sector, has witnessed a notable shift in its valuation parameters, moving from an attractive to a fair valuation grade. Despite this, the stock has delivered exceptional returns, outperforming the Sensex significantly over multiple time horizons. This article analyses the recent changes in key valuation metrics, compares them with peer averages, and assesses the implications for investors.
Read full news article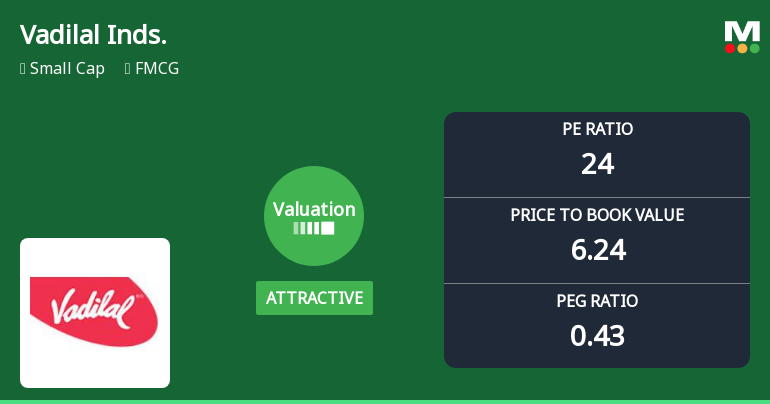
Vadilal Industries Ltd Valuation Shifts Signal Strong Buy Opportunity
Vadilal Industries Ltd has witnessed a significant shift in its valuation parameters, moving from a fair to an attractive rating, supported by robust financial metrics and impressive market returns. This re-rating comes as the company continues to outperform the broader Sensex, signalling renewed investor confidence in this FMCG small-cap player.
Read full news article
Vadilal Industries Ltd is Rated Strong Buy
Vadilal Industries Ltd is rated Strong Buy by MarketsMOJO, with this rating last updated on 12 August 2026. While the rating change occurred on that date, the analysis and financial metrics presented here reflect the stock’s current position as of 23 August 2026, providing investors with the latest insights into the company’s performance and outlook.
Read full news article Announcements
Vadilal Industries Limited - Updates
27-Nov-2019 | Source : NSEVadilal Industries Limited has informed the Exchange regarding 'Transfer of shares to Investor Education & Protection Fund pursuant to Section 124(6) of the Companies Act, 2013'.
Vadilal Industries Limited - Updates
18-Nov-2019 | Source : NSEVadilal Industries Limited has informed the Exchange regarding 'Resignation of Auditor'.
Related Party Transactions
23-Sep-2019 | Source : NSE
| Vadilal Industries Limited has informed the Exchange regarding Disclosure of Related Party Transactions pursuant to Regulation 23(9) of the Securities and Exchange Board of India (Listing Obligations and Disclosure Requirements) Regulations,2015 ("Listings Regulations"). |
Corporate Actions

No Upcoming Board Meetings

Vadilal Industries Ltd has declared 430% dividend, ex-date: 03 Sep 26

No Splits history available

No Bonus history available

No Rights history available
Key FactorsQuality key factors
Valuation key factors
Technicals key factors
 Technical Indicator Scale: Bearish, Mildly Bearish, Sideways, Mildly Bullish, Bullish Turned Shareholding
Shareholding Snapshot : Jun 2026
Shareholding Compare (%holding)
Promoters
7.5225
Held by 1 Schemes (0.0%)
Held by 37 FIIs (1.02%)
Vadilal International Pvt Ltd (39.09%)
Kifs Trade Capital Private Limited (1.14%)
18.56%
FinancialQuarterly Results Snapshot (Consolidated) - Jun'26 - YoY
 Compare with Peers
YoY Growth in quarter ended Jun 2026 is 34.24% vs 9.12% in Jun 2025
YoY Growth in quarter ended Jun 2026 is 95.45% vs -13.48% in Jun 2025

Half Yearly Results Snapshot (Consolidated) - Sep'25
Growth in half year ended Sep 2025 is 11.51% vs 8.60% in Sep 2024

Growth in half year ended Sep 2025 is -13.75% vs 6.72% in Sep 2024
Nine Monthly Results Snapshot (Consolidated) - Dec'25
YoY Growth in nine months ended Dec 2025 is 12.69% vs 10.27% in Dec 2024
YoY Growth in nine months ended Dec 2025 is -21.89% vs 8.47% in Dec 2024
Annual Results Snapshot (Consolidated) - Mar'26
YoY Growth in year ended Mar 2026 is 21.19% vs 10.21% in Mar 2025
YoY Growth in year ended Mar 2026 is 3.17% vs 3.00% in Mar 2025
 Company CV
About Vadilal Industries Ltd

Company Coordinates










