
Compare Everest Inds. with Similar Stocks
Dashboard
With a Operating Losses, the company has a Weak Long Term Fundamental Strength
- The company has been able to generate a Return on Equity (avg) of 3.48% signifying low profitability per unit of shareholders funds
With a fall in Net Sales of -27.72%, the company declared Very Negative results in Mar 26
Risky - Negative EBITDA
Despite the size of the company, domestic mutual funds hold only 0.05% of the company
Consistent Underperformance against the benchmark over the last 3 years
Stock DNA
Miscellaneous
INR 677 Cr (Micro Cap)
NA (Loss Making)
13
0.61%
0.37
-17.81%
1.32
Total Returns (Price + Dividend) 
Latest dividend: 2.5 per share ex-dividend date: Sep-12-2025
Risk Adjusted Returns v/s
Returns Beta

News

Everest Industries Ltd is Rated Strong Sell
Everest Industries Ltd is rated Strong Sell by MarketsMOJO, with this rating last updated on 29 Sep 2025. However, the analysis and financial metrics discussed here reflect the stock’s current position as of 26 June 2026, providing investors with the latest insights into the company’s performance and outlook.
Read full news article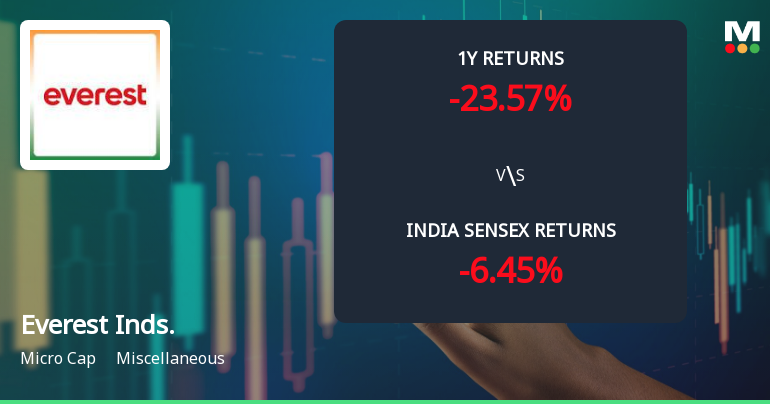
Everest Industries Ltd Technical Momentum Shifts Amid Mixed Market Signals
Everest Industries Ltd has exhibited a notable shift in its technical momentum, moving from a mildly bearish stance to a sideways trend, reflecting a complex interplay of bullish and bearish signals across key technical indicators. Despite a strong intraday gain of 4.26% to close at ₹395.20, the stock remains under pressure when viewed against broader market benchmarks and its historical performance.
Read full news article
Everest Industries Ltd is Rated Strong Sell
Everest Industries Ltd is rated Strong Sell by MarketsMOJO, with this rating last updated on 29 September 2025. However, the analysis and financial metrics discussed here reflect the company’s current position as of 15 June 2026, providing investors with an up-to-date view of its performance and outlook.
Read full news article Announcements
Everest Industries Limited - Appointment
22-Nov-2019 | Source : NSEEverest Industries Limited has informed the Exchange regarding Appointment of Mr Anant Talaulicar as Independent Director of the company w.e.f. November 21, 2019.
Everest Industries Limited - Investor Presentation
25-Oct-2019 | Source : NSEEverest Industries Limited has informed the Exchange regarding Investor Presentation
Everest Industries Limited - Updates
09-Oct-2019 | Source : NSEEverest Industries Limited has informed the Exchange regarding 'In connection with the requirement under paragraph 9(0) of the SEBI Circular No. CIR/CFD/DIL/7/2013 dated May 13, 2013 (the "SEBI ESOP Clarification"), we are hereby forwarding the enclosed disclosure on behalf of Everest Staff Welfare Trust (the "ESWT") for your reference and
Corporate Actions

No Upcoming Board Meetings

Everest Industries Ltd has declared 25% dividend, ex-date: 12 Sep 25

No Splits history available

No Bonus history available

No Rights history available
Quality key factors
Valuation key factors
Technicals key factors
 Technical Indicator Scale: Bearish, Mildly Bearish, Sideways, Mildly Bullish, Bullish Turned
 Shareholding Snapshot : Mar 2026
Shareholding Compare (%holding)
Promoters
None
Held by 2 Schemes (0.03%)
Held by 15 FIIs (10.29%)
Falak Investment Private Limited (50.22%)
Massachusetts Institute Of Technology (9.93%)
28.81%
Quarterly Results Snapshot (Consolidated) - Mar'26 - YoY

YoY Growth in quarter ended Mar 2026 is -27.72% vs 4.75% in Mar 2025
YoY Growth in quarter ended Mar 2026 is -717.41% vs 40.44% in Mar 2025
Half Yearly Results Snapshot (Consolidated) - Sep'25
Growth in half year ended Sep 2025 is -10.26% vs 13.57% in Sep 2024
Growth in half year ended Sep 2025 is -491.02% vs -64.00% in Sep 2024
Nine Monthly Results Snapshot (Consolidated) - Dec'25
YoY Growth in nine months ended Dec 2025 is -14.20% vs 11.09% in Dec 2024
YoY Growth in nine months ended Dec 2025 is -384.62% vs -189.57% in Dec 2024
Annual Results Snapshot (Consolidated) - Mar'26
YoY Growth in year ended Mar 2026 is -17.75% vs 9.35% in Mar 2025
YoY Growth in year ended Mar 2026 is -2,724.72% vs -120.00% in Mar 2025
About Everest Industries Ltd

Company Coordinates


