
Compare Everest Organics with Similar Stocks
Dashboard
Weak Long Term Fundamental Strength with a -7.30% CAGR growth in Operating Profits over the last 5 years
- Low ability to service debt as the company has a high Debt to EBITDA ratio of 2.52 times
- The company has been able to generate a Return on Equity (avg) of 2.02% signifying low profitability per unit of shareholders funds
Flat results in Mar 26
Underperformed the market in the last 1 year
Stock DNA
Pharmaceuticals & Biotechnology
INR 249 Cr (Micro Cap)
45.00
33
0.00%
0.65
7.37%
3.31
Total Returns (Price + Dividend) 
Latest dividend: 0.5 per share ex-dividend date: Sep-15-2022
Risk Adjusted Returns v/s
Returns Beta

News
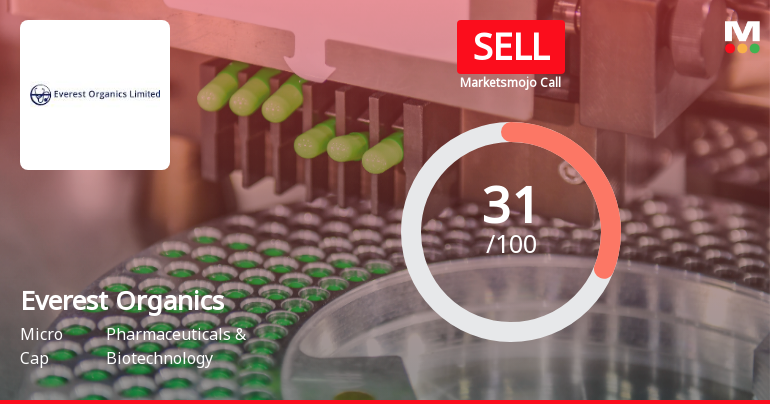
Everest Organics Ltd Downgraded to Sell Amid Mixed Financial and Valuation Signals
Everest Organics Ltd has seen its investment rating upgraded from Strong Sell to Sell as of 3 June 2026, reflecting a nuanced shift across key parameters including quality, valuation, financial trend, and technicals. Despite a challenging recent performance, the company’s valuation metrics and certain financial indicators have improved, prompting a reassessment of its market stance.
Read full news article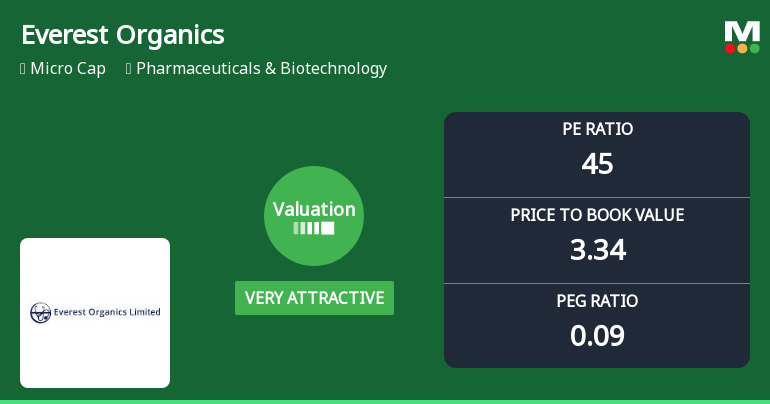
Everest Organics Ltd Valuation Shifts Signal Renewed Price Attractiveness Amid Market Challenges
Everest Organics Ltd, a micro-cap player in the Pharmaceuticals & Biotechnology sector, has seen a notable shift in its valuation parameters, moving from an attractive to a very attractive price level. Despite recent price declines and a challenging year-to-date performance, the company’s valuation metrics now present a compelling case for investors seeking value in a volatile market.
Read full news article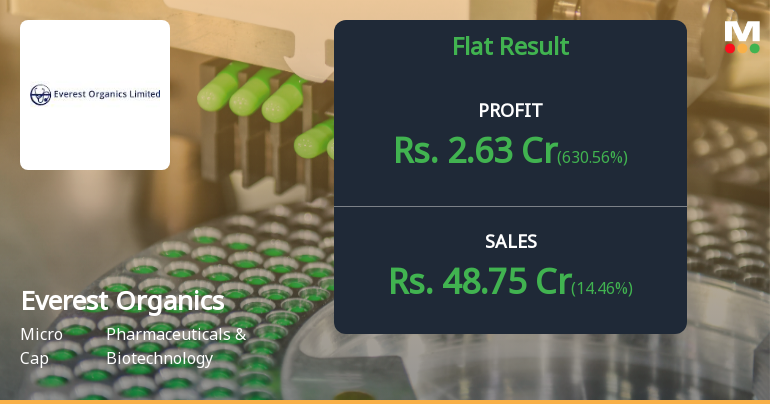
Everest Organics Q4 FY26: Margin Recovery Masks Underlying Weakness
Everest Organics Ltd., a Hyderabad-based active pharmaceutical ingredients manufacturer with a market capitalisation of ₹252.00 crores, reported a net profit of ₹2.63 crores for Q4 FY26, marking a significant sequential recovery from ₹0.36 crores in Q3 FY26. However, the stock has plummeted 38.88% over the past year, significantly underperforming the Sensex's 8.40% decline, as investors remain concerned about deteriorating fundamentals and anaemic long-term growth.
Read full news article Announcements
Announcement under Regulation 30 (LODR)-Newspaper Publication
01-Jun-2026 | Source : BSENewspaper publication of Audited Financial Results for the quarter and year ended March 31 2026.
Announcement under Regulation 30 (LODR)-Change in Directorate
29-May-2026 | Source : BSEAppointment of Mr. Narra Venkata Ramana as Additional Director in the Board Meeting held today i.e. May 29 2026.
Board Meeting Outcome for Outcome Of The Board Meeting Held Today I.E. May 29 2026.
29-May-2026 | Source : BSEOutcome of the Board Meeting held today .i.e. May 29 2026.
Corporate Actions

No Upcoming Board Meetings

Everest Organics Ltd has declared 5% dividend, ex-date: 15 Sep 22

No Splits history available

No Bonus history available

No Rights history available
Quality key factors
Valuation key factors
Technicals key factors
 Technical Indicator Scale: Bearish, Mildly Bearish, Sideways, Mildly Bullish, Bullish Turned
 Shareholding Snapshot : Mar 2026
Shareholding Compare (%holding)
Promoters
None
Held by 0 Schemes
Held by 0 FIIs
Veerat Finance Investment Limited (38.37%)
Greenpath Energy Private Limited (7.53%)
26.91%
Quarterly Results Snapshot (Standalone) - Mar'26 - QoQ

QoQ Growth in quarter ended Mar 2026 is 14.46% vs -16.49% in Dec 2025
QoQ Growth in quarter ended Mar 2026 is 630.56% vs -68.97% in Dec 2025
Half Yearly Results Snapshot (Standalone) - Sep'25
Growth in half year ended Sep 2025 is 37.04% vs -16.97% in Sep 2024
Growth in half year ended Sep 2025 is 147.85% vs -1,883.33% in Sep 2024
Nine Monthly Results Snapshot (Standalone) - Dec'25
YoY Growth in nine months ended Dec 2025 is 24.35% vs -18.04% in Dec 2024
YoY Growth in nine months ended Dec 2025 is 169.36% vs -1,415.62% in Dec 2024
Annual Results Snapshot (Standalone) - Mar'26
YoY Growth in year ended Mar 2026 is 23.00% vs -19.14% in Mar 2025
YoY Growth in year ended Mar 2026 is 530.23% vs -1,021.43% in Mar 2025
About Everest Organics Ltd

Company Coordinates


