
Compare Excel Industries with Similar Stocks
Stock DNA
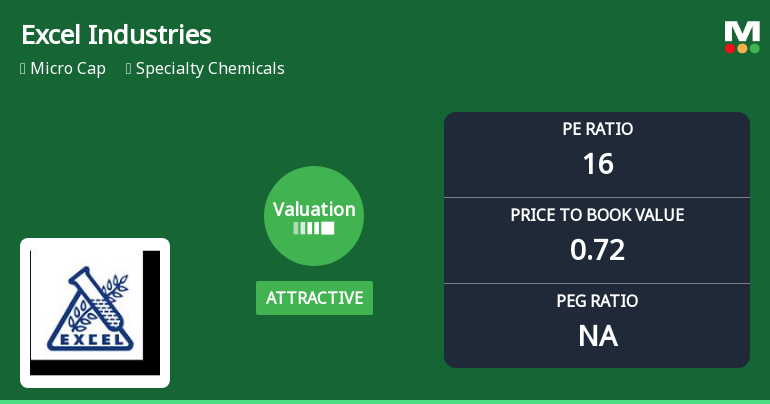
Specialty Chemicals
INR 1,246 Cr (Micro Cap)
16.00
29
1.37%
-0.08
4.44%
0.74
Total Returns (Price + Dividend) 
Latest dividend: 13.816347753743761 per share ex-dividend date: Aug-14-2025
Risk Adjusted Returns v/s
Returns Beta

News
Excel Industries Ltd Valuation Improves Amid Mixed Market Returns
Excel Industries Ltd has witnessed a notable shift in its valuation parameters, moving from a very attractive to an attractive rating, reflecting a recalibration in price attractiveness amid mixed financial metrics and sector comparisons. This article analyses the recent changes in key valuation ratios, peer benchmarks, and market performance to provide a comprehensive view for investors.
Read full news article
Excel Industries Ltd Sees Technical Momentum Shift Amid Mixed Market Signals
Excel Industries Ltd, a micro-cap player in the Specialty Chemicals sector, has exhibited a nuanced shift in its technical momentum, moving from a bearish to a mildly bearish trend. Despite a 2.76% gain on 27 Jul 2026, the stock’s technical indicators present a complex picture, with mixed signals from MACD, RSI, moving averages, and other momentum tools, underscoring the challenges investors face in assessing its near-term trajectory.
Read full news article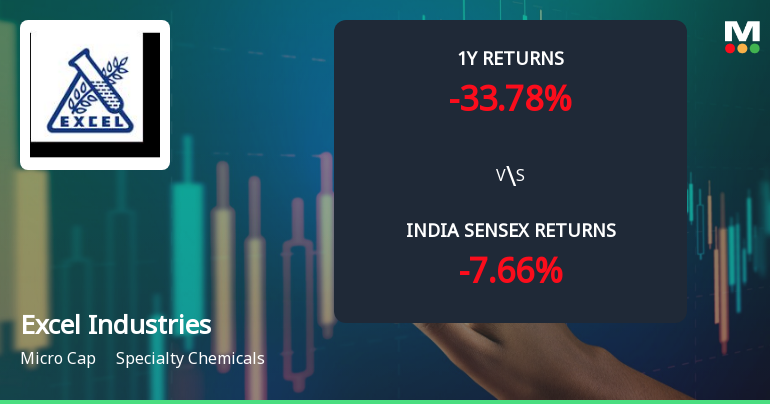
Excel Industries Ltd Technical Momentum Shifts to Bearish Amid Market Pressure
Excel Industries Ltd has experienced a notable shift in its technical momentum, with key indicators signalling a bearish trend. Despite a recent downgrade in its Mojo Grade to 'Sell' from 'Strong Sell', the stock’s price action and technical parameters reveal a complex picture for investors navigating the specialty chemicals sector.
Read full news article Announcements
Disclosure Under Regulation 30 Of SEBI (LODR) Regulations 2015
23-Jul-2026 | Source : BSEWe hereby inform you that the Company is proposing to commission a project to produce a new product for setting up a 1265 MTPA facility for manufacturing a specialty chemical at our Lote site.
Disclosure Under Regulation 30 SEBI (Listing Obligations And Disclosure Requirements) Regulations 2015
23-Jul-2026 | Source : BSEThis is with reference to disclosure made on 12th November 2025 pursuant to provisions of Regulation 30 read with Schedule III Part A para B of the SEBI (Listing Obligations and Disclosure Requirements) Regulations 2015 with respect to signing of a binding term sheet with an Indian Specialty Chemicals Company for the contract manufacturing and supply of specialty chemicals with an expected annual income (net of raw material cost) of Rs 35-40 Cr. We had also intimated that we would be commissioning a dedicated setup to cater to the supplies at estimated CAPEX of Rs. 40 Cr. As an update we are pleased to inform you that the project has been successfully completed on 23rd July 2026
Announcement under Regulation 30 (LODR)-Press Release / Media Release
23-Jul-2026 | Source : BSEPursuant to Regulation 30 of SEBI (LODR) Regulations 2015 please find enclosed press release titled Update - Completion of Project for supplies against long term supply agreement.
Corporate Actions

No Upcoming Board Meetings

Excel Industries Ltd has declared 275% dividend, ex-date: 14 Aug 25

No Splits history available

No Bonus history available

No Rights history available
Quality key factors
Valuation key factors
Technicals key factors
 Technical Indicator Scale: Bearish, Mildly Bearish, Sideways, Mildly Bullish, Bullish Turned
 Shareholding Snapshot : Jun 2026
Shareholding Compare (%holding)
Promoters
None
Held by 4 Schemes (0.01%)
Held by 37 FIIs (1.86%)
Anshul Specialty Molecules Private Limited (42.92%)
Life Insurance Corporation Of India (6.69%)
30.64%
Quarterly Results Snapshot (Consolidated) - Mar'26 - QoQ

QoQ Growth in quarter ended Mar 2026 is 20.42% vs -13.58% in Dec 2025
QoQ Growth in quarter ended Mar 2026 is 45.50% vs -60.17% in Dec 2025
Half Yearly Results Snapshot (Consolidated) - Sep'25

Growth in half year ended Sep 2025 is 8.60% vs 29.46% in Sep 2024
Growth in half year ended Sep 2025 is -17.62% vs 770.76% in Sep 2024
Nine Monthly Results Snapshot (Consolidated) - Dec'25
YoY Growth in nine months ended Dec 2025 is 11.37% vs 23.22% in Dec 2024
YoY Growth in nine months ended Dec 2025 is -13.05% vs 605.03% in Dec 2024
Annual Results Snapshot (Consolidated) - Mar'26
YoY Growth in year ended Mar 2026 is 11.91% vs 18.39% in Mar 2025
YoY Growth in year ended Mar 2026 is -11.30% vs 401.53% in Mar 2025
About Excel Industries Ltd

Company Coordinates


