
Compare Jyoti Resins with Similar Stocks
Dashboard
With ROE of 27.7, it has a Expensive valuation with a 4.4 Price to Book Value
- The stock is trading at a discount compared to its peers' average historical valuations
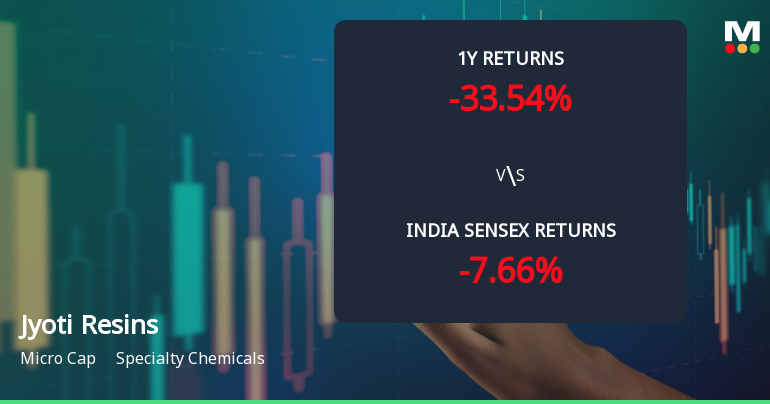
- Over the past year, while the stock has generated a return of -33.61%, its profits have fallen by -5.3%
Despite the size of the company, domestic mutual funds hold only 0% of the company
Consistent Underperformance against the benchmark over the last 3 years
Stock DNA
Specialty Chemicals
INR 1,110 Cr (Micro Cap)
16.00
46
0.97%
-0.69
27.66%
4.42
Total Returns (Price + Dividend) 
Latest dividend: 8.979545454545454 per share ex-dividend date: Sep-19-2025
Risk Adjusted Returns v/s
Returns Beta

News
Jyoti Resins and Adhesives Ltd Faces Bearish Momentum Amid Technical Parameter Shift
Jyoti Resins and Adhesives Ltd, a micro-cap player in the Specialty Chemicals sector, has experienced a notable shift in its technical momentum, with several key indicators signalling a bearish trend. Despite a strong long-term return profile, recent price action and technical parameters suggest caution for investors as the stock navigates a challenging phase.
Read full news article
Jyoti Resins and Adhesives Ltd is Rated Sell
Jyoti Resins and Adhesives Ltd is rated 'Sell' by MarketsMOJO, with this rating last updated on 07 May 2026. However, the analysis and financial metrics discussed here reflect the stock's current position as of 20 July 2026, providing investors with the latest insights into its performance and outlook.
Read full news article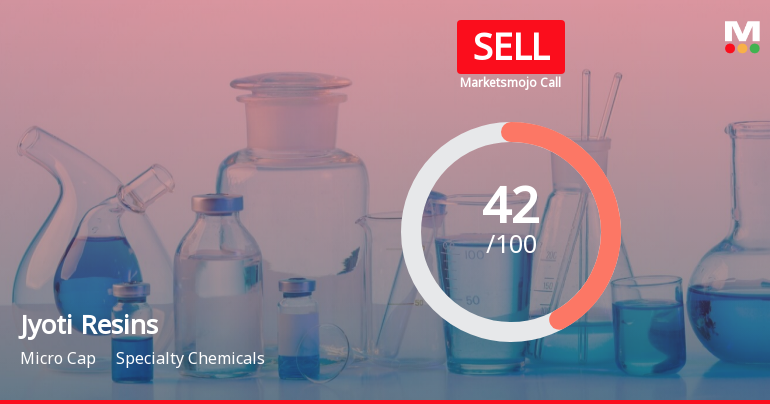
Jyoti Resins and Adhesives Ltd is Rated Sell
Jyoti Resins and Adhesives Ltd is rated 'Sell' by MarketsMOJO, with this rating last updated on 07 May 2026. However, the analysis and financial metrics discussed here reflect the stock's current position as of 09 July 2026, providing investors with an up-to-date view of the company’s performance and outlook.
Read full news article Announcements
Board Meeting Outcome for Outcome Of Board Meeting
10-Jul-2026 | Source : BSEResignation of Ms. Tejal Varde Company Secretary and Compliance Officer W.E.F 10.07.2026
Announcement under Regulation 30 (LODR)-Resignation of Company Secretary / Compliance Officer
10-Jul-2026 | Source : BSEResignation of Ms.Tejal Varde Company Secretary and Compliance Officer W.E.F. 10.07.2026.
Board Meeting Outcome for Outcome Of Board Meeting Under Regulation 30 Of SEBI (LODR) Regulations 2015
27-Jun-2026 | Source : BSEThe Company has approved the proposal for Direct Listing of the Equity Shares of the Company on the Main Board of the National Stock Exchange of India Limited (NSE).
Corporate Actions

No Upcoming Board Meetings

Jyoti Resins and Adhesives Ltd has declared 90% dividend, ex-date: 19 Sep 25

No Splits history available

Jyoti Resins and Adhesives Ltd has announced 2:1 bonus issue, ex-date: 08 Sep 22

No Rights history available
Quality key factors
Valuation key factors
Technicals key factors
 Technical Indicator Scale: Bearish, Mildly Bearish, Sideways, Mildly Bullish, Bullish Turned
 Shareholding Snapshot : Jun 2026
Shareholding Compare (%holding)
Promoters
None
Held by 0 Schemes
Held by 3 FIIs (0.06%)
Jagdish Nathalal Patel (22.25%)
Udita Tapan Patel (6.02%)
39.56%
Quarterly Results Snapshot (Standalone) - Mar'26 - QoQ

QoQ Growth in quarter ended Mar 2026 is 28.53% vs -2.78% in Dec 2025
QoQ Growth in quarter ended Mar 2026 is 30.64% vs -10.43% in Dec 2025
Half Yearly Results Snapshot (Standalone) - Sep'25
Growth in half year ended Sep 2025 is 11.20% vs 8.29% in Sep 2024

Growth in half year ended Sep 2025 is -1.46% vs 9.84% in Sep 2024
Nine Monthly Results Snapshot (Standalone) - Dec'25
YoY Growth in nine months ended Dec 2025 is 7.92% vs 10.46% in Dec 2024
YoY Growth in nine months ended Dec 2025 is -7.76% vs 11.91% in Dec 2024
Annual Results Snapshot (Standalone) - Mar'26
YoY Growth in year ended Mar 2026 is 10.78% vs 10.42% in Mar 2025
YoY Growth in year ended Mar 2026 is -5.28% vs 10.07% in Mar 2025
About Jyoti Resins and Adhesives Ltd

Company Coordinates


