
Compare Excel Industries with Similar Stocks
Dashboard
Poor long term growth as Operating profit has grown by an annual rate -1.32% of over the last 5 years
Negative results in Dec 25
Despite the size of the company, domestic mutual funds hold only 0.01% of the company
Consistent Underperformance against the benchmark over the last 3 years
Stock DNA
Specialty Chemicals
INR 1,264 Cr (Micro Cap)
17.00
29
1.38%
-0.11
4.07%
0.69
Total Returns (Price + Dividend) 
Latest dividend: 13.75 per share ex-dividend date: Aug-14-2025
Risk Adjusted Returns v/s
Returns Beta

News
Are Excel Industries Ltd latest results good or bad?
Excel Industries Ltd's latest financial results for Q4 FY26 present a complex picture of operational performance. The company reported a net profit of ₹12.28 crores, reflecting a significant sequential improvement of 45.50% compared to the previous quarter. However, this figure represents a slight decline of 1.05% year-on-year, indicating challenges in sustaining profitability despite an increase in revenue. Revenue for the quarter reached ₹281.24 crores, marking a 20.42% increase from the preceding quarter and a 13.48% rise compared to the same quarter last year. This growth in revenue is noteworthy; however, it has not translated into improved profitability metrics. The operating margin, which stood at 7.82%, has experienced a substantial decline of 589 basis points year-on-year, highlighting ongoing margin compression that has affected the company's overall profitability. The financial data suggests th...
Read full news article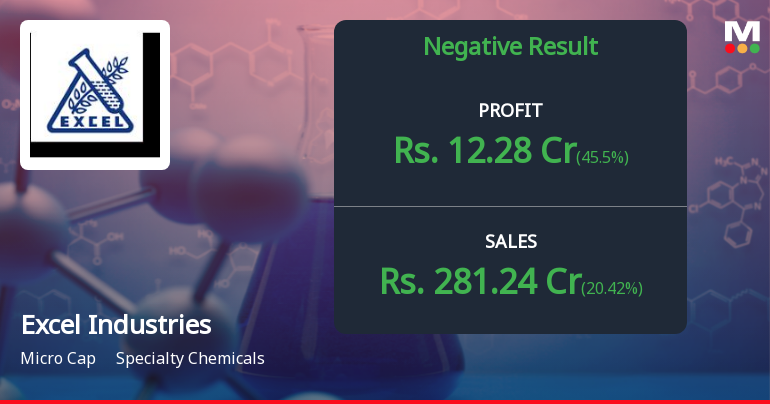
Excel Industries Q4 FY26: Profit Surge Masks Margin Erosion Concerns
Excel Industries Ltd., a Mumbai-based speciality chemicals manufacturer, reported a net profit of ₹12.28 crores for Q4 FY26, marking a sharp 45.50% quarter-on-quarter recovery but declining 1.05% year-on-year. The ₹1,264 crore market capitalisation company posted revenues of ₹281.24 crores for the March quarter, reflecting a 20.42% sequential improvement but a modest 13.48% annual gain. Despite the profit rebound, the stock has declined 30.55% from its 52-week high of ₹1,438.00, currently trading at ₹998.75 and reflecting investor concerns over deteriorating operational efficiency and sustained margin pressures.
Read full news article
Excel Industries Ltd is Rated Sell
Excel Industries Ltd is rated Sell by MarketsMOJO, with this rating last updated on 30 March 2026. However, the analysis and financial metrics discussed here reflect the stock’s current position as of 14 May 2026, providing investors with an up-to-date view of the company’s fundamentals, returns, and market performance.
Read full news article Announcements
Board Meeting Outcome for Outcome Of Board Meeting.
22-May-2026 | Source : BSEPursuant to Regulation 30 of the SEBI (LODR) Regulations 2015 we wish to inform you that at the meeting of the Board In compliance with the provisions of the Regulation 33(3)(d) of the SEBI (Listing Obligations and Disclosure Requirements) Regulations 2015 we declare that the above Auditors Report is with unmodified opinion with respect to Financial Results (Standalone & Consolidated) of the Company for the year ended 31st March 2026. Further the Board has recommended a dividend of Rs. 13.75/- (275%) per equity share of the face value of Rs. 5/- each for the FY 2025-26 subject to the approval of the shareholders at the ensuing Annual General Meeting (AGM) of the Company.
Announcement under Regulation 30 (LODR)-Change in Management
22-May-2026 | Source : BSEDisclosure under Regulation 30 for appointment of Director
Audited Financial Results For The Period Ended 31St March 2026
22-May-2026 | Source : BSEOutcome of Board Meeting.
Corporate Actions

No Upcoming Board Meetings

Excel Industries Ltd has declared 275% dividend, ex-date: 14 Aug 25

No Splits history available

No Bonus history available

No Rights history available
Quality key factors
Valuation key factors
Technicals key factors
 Technical Indicator Scale: Bearish, Mildly Bearish, Sideways, Mildly Bullish, Bullish Turned
 Shareholding Snapshot : Mar 2026
Shareholding Compare (%holding)
Promoters
None
Held by 4 Schemes (0.01%)
Held by 40 FIIs (1.94%)
Anshul Specialty Molecules Private Limited (42.92%)
Life Insurance Corporation Of India (6.69%)
30.64%
Quarterly Results Snapshot (Consolidated) - Mar'26 - QoQ

QoQ Growth in quarter ended Mar 2026 is 20.42% vs -13.58% in Dec 2025
QoQ Growth in quarter ended Mar 2026 is 45.50% vs -60.17% in Dec 2025
Half Yearly Results Snapshot (Consolidated) - Sep'25

Growth in half year ended Sep 2025 is 8.60% vs 29.46% in Sep 2024
Growth in half year ended Sep 2025 is -17.62% vs 770.76% in Sep 2024
Nine Monthly Results Snapshot (Consolidated) - Dec'25
YoY Growth in nine months ended Dec 2025 is 11.37% vs 23.22% in Dec 2024
YoY Growth in nine months ended Dec 2025 is -13.05% vs 605.03% in Dec 2024
Annual Results Snapshot (Consolidated) - Mar'26
YoY Growth in year ended Mar 2026 is 11.91% vs 18.39% in Mar 2025
YoY Growth in year ended Mar 2026 is -11.30% vs 401.53% in Mar 2025
About Excel Industries Ltd

Company Coordinates


