
Compare Exicom Tele-Sys. with Similar Stocks
Dashboard
Weak Long Term Fundamental Strength with an average Return on Capital Employed (ROCE) of 0%
- Poor long term growth as Operating profit has grown by an annual rate -253.25% of over the last 5 years
- Low ability to service debt as the company has a high Debt to EBITDA ratio of -6.90 times
Risky - Negative EBITDA
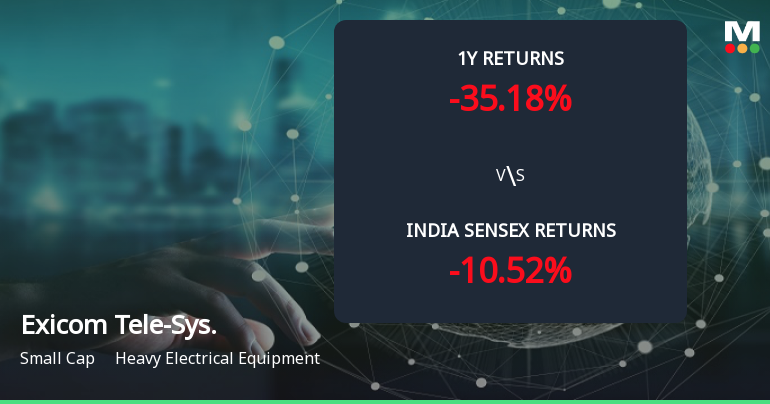
Underperformed the market in the last 1 year
Stock DNA
Heavy Electrical Equipment
INR 2,082 Cr (Small Cap)
NA (Loss Making)
44
0.00%
1.00
-39.55%
3.20
Total Returns (Price + Dividend) 
Exicom Tele-Sys. for the last several years.
Risk Adjusted Returns v/s
Returns Beta

News
Golden Cross Forms in Exicom Tele-Systems Ltd — On a Day the Stock Fell 9.0%. What the Mixed Signals Mean
The 50-day moving average has crossed above the 200-day moving average for Exicom Tele-Systems Ltd, signalling a golden cross on 11 Jun 2026. Yet, the stock declined sharply by 9.02% on the same day, while monthly technical indicators remain bearish. This juxtaposition of signals calls for a detailed examination of the cross’s reliability in the current context.
Read full news article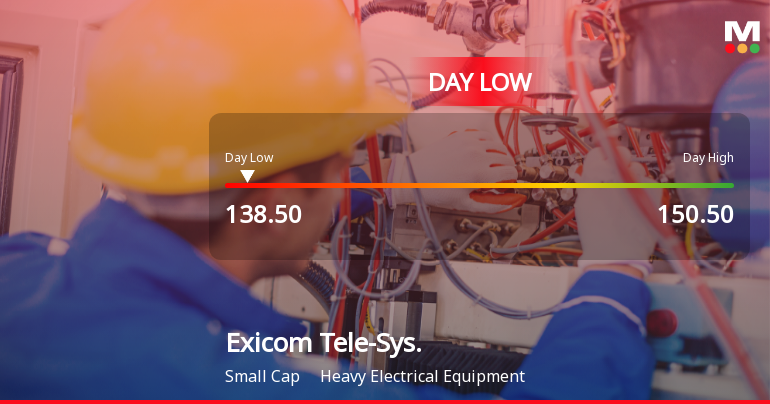
Exicom Tele-Systems Ltd Hits Intraday Low Amid Price Pressure on 11 Jun 2026
Exicom Tele-Systems Ltd experienced a notable decline today, touching an intraday low of Rs 139.4, reflecting a 6.85% drop as the stock faced significant price pressure amid a mixed market environment.
Read full news article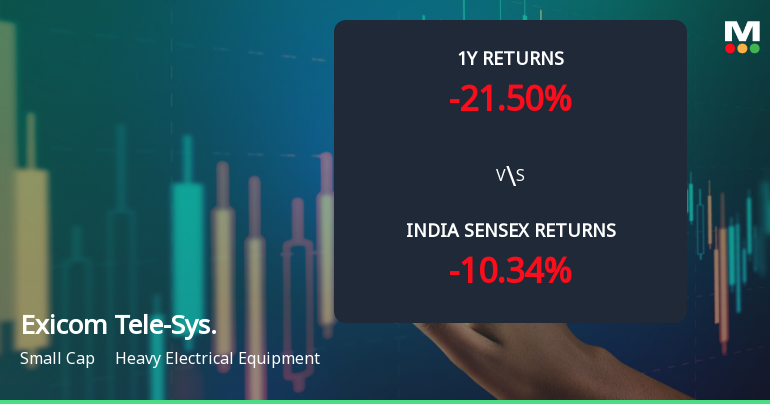
Exicom Tele-Systems Ltd Technical Momentum Shifts Amid Mixed Market Signals
Exicom Tele-Systems Ltd, a small-cap player in the Heavy Electrical Equipment sector, has experienced a notable shift in its technical momentum, moving from a mildly bearish stance to a sideways trend. Despite a recent downgrade to a Strong Sell rating by MarketsMOJO, the stock exhibits a complex interplay of bullish and bearish technical indicators, reflecting a nuanced market sentiment as it navigates volatile price action.
Read full news article Announcements
Announcement under Regulation 30 (LODR)-Earnings Call Transcript
21-May-2026 | Source : BSEThe Company hereby submit the Transcript of the Investors/Analyst Conference call held on Tuesday May 19 2026 at 4:00 P.M.(IST)
Announcement under Regulation 30 (LODR)-Analyst / Investor Meet - Outcome
19-May-2026 | Source : BSESubmission of Audio Recording of the investors call held on May 19 2026
Submission Of Statement Of Deviation & Variation
19-May-2026 | Source : BSESubmission of Statement of Nil Deviation or Variation in utilization of proceeds for the quarter ended March 31 2026
Corporate Actions

No Upcoming Board Meetings

No Dividend history available

No Splits history available

No Bonus history available

Exicom Tele-Systems Ltd has announced 3:20 rights issue, ex-date: 07 Jul 25
Quality key factors
Valuation key factors
Technicals key factors
 Technical Indicator Scale: Bearish, Mildly Bearish, Sideways, Mildly Bullish, Bullish Turned
 Shareholding Snapshot : Mar 2026
Shareholding Compare (%holding)
Promoters
2.7762
Held by 3 Schemes (3.38%)
Held by 5 FIIs (0.2%)
Nextwave Communications Private Limited (54.72%)
Belgrave Investment Fund (3.74%)
23.36%
Quarterly Results Snapshot (Consolidated) - Mar'26 - QoQ

QoQ Growth in quarter ended Mar 2026 is 40.19% vs -1.77% in Dec 2025
QoQ Growth in quarter ended Mar 2026 is 19.98% vs 1.37% in Dec 2025
Half Yearly Results Snapshot (Consolidated) - Sep'25
Growth in half year ended Sep 2025 is 20.12% vs -10.90% in Sep 2024

Growth in half year ended Sep 2025 is -12,657.85% vs -95.59% in Sep 2024
Nine Monthly Results Snapshot (Consolidated) - Dec'25
YoY Growth in nine months ended Dec 2025 is 26.86% vs -16.23% in Dec 2024
YoY Growth in nine months ended Dec 2025 is -360.26% vs -231.03% in Dec 2024
Annual Results Snapshot (Consolidated) - Mar'26
YoY Growth in year ended Mar 2026 is 32.75% vs -14.91% in Mar 2025
YoY Growth in year ended Mar 2026 is -149.14% vs -272.14% in Mar 2025
About Exicom Tele-Systems Ltd

Company Coordinates


