
Compare Fabtech Tech. with Similar Stocks
Dashboard
The company is Net-Debt Free
- PBT LESS OI(Q) At Rs 20.18 cr has Grown at 255.0% (vs previous 4Q average)
- PAT(Q) At Rs 22.06 cr has Grown at 197.9% (vs previous 4Q average)
- NET SALES(Q) Highest at Rs 158.52 cr
With ROE of 13.1, it has a Attractive valuation with a 4 Price to Book Value
Despite the size of the company, domestic mutual funds hold only 0% of the company
Stock DNA
Industrial Manufacturing
INR 688 Cr (Micro Cap)
19.00
39
0.00%
0.02
13.08%
4.11
Total Returns (Price + Dividend) 
Fabtech Tech. for the last several years.
Risk Adjusted Returns v/s
Returns Beta

News
Fabtech Technologies Ltd is Rated Hold by MarketsMOJO
Fabtech Technologies Ltd is rated 'Hold' by MarketsMOJO, with this rating last updated on 18 May 2026. While the rating change occurred on that date, the analysis and financial metrics discussed here reflect the company’s current position as of 13 July 2026, providing investors with an up-to-date view of the stock’s fundamentals, valuation, financial trends, and technical outlook.
Read full news article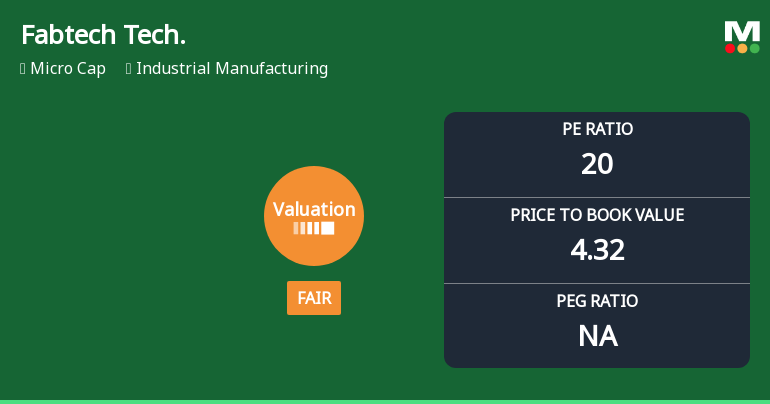
Fabtech Technologies Ltd Valuation Shifts to Fair Amid Mixed Market Returns
Fabtech Technologies Ltd, a micro-cap player in the industrial manufacturing sector, has seen a notable shift in its valuation parameters, moving from an attractive to a fair rating. This change reflects evolving market perceptions amid fluctuating price-to-earnings (P/E) and price-to-book value (P/BV) ratios, alongside comparisons with industry peers and historical benchmarks.
Read full news article
Fabtech Technologies Ltd is Rated Hold
Fabtech Technologies Ltd is rated 'Hold' by MarketsMOJO, with this rating last updated on 18 May 2026. While the rating change occurred on that date, the analysis and financial metrics discussed here reflect the company’s current position as of 02 July 2026, providing investors with an up-to-date view of the stock’s fundamentals, valuation, financial trends, and technical outlook.
Read full news article Announcements
Compliances-Certificate under Reg. 74 (5) of SEBI (DP) Regulations 2018
07-Jul-2026 | Source : BSEPFA Certificate under SEBI (Depositories and Participants) Regulations 2018
Shareholder Meeting / Postal Ballot-Outcome of Postal_Ballot
02-Jul-2026 | Source : BSEPlease find attached Scrutinizers Report and Voting Result.
Shareholder Meeting / Postal Ballot-Scrutinizers Report
02-Jul-2026 | Source : BSEPFA Scrutinizer Report
Corporate Actions

No Upcoming Board Meetings

No Dividend history available

No Splits history available

No Bonus history available

No Rights history available
Quality key factors
Valuation key factors
Technicals key factors
 Technical Indicator Scale: Bearish, Mildly Bearish, Sideways, Mildly Bullish, Bullish Turned
 Shareholding Snapshot : Jun 2026
Shareholding Compare (%holding)
Promoters
None
Held by 2 Schemes (0.0%)
Held by 2 FIIs (0.02%)
Aasif Ahsan Khan (41.52%)
Keya Vimal Salot (1.41%)
21.4%
Quarterly Results Snapshot (Standalone) - Dec'25 - QoQ

QoQ Growth in quarter ended Dec 2025 is -41.47% vs 25.36% in Sep 2025
QoQ Growth in quarter ended Dec 2025 is -93.03% vs 253.39% in Sep 2025
Half Yearly Results Snapshot (Standalone) - Sep'25
Not Applicable: The company has declared_date for only one period
Not Applicable: The company has declared_date for only one period
Nine Monthly Results Snapshot (Standalone) - Dec'25
Not Applicable: The company has declared_date for only one period
Not Applicable: The company has declared_date for only one period
Annual Results Snapshot (Standalone) - Mar'25

YoY Growth in year ended Mar 2025 is 21.99% vs -24.64% in Mar 2023
YoY Growth in year ended Mar 2025 is 104.91% vs -17.23% in Mar 2023
About Fabtech Technologies Ltd

Company Coordinates


