
Compare Facor Alloys with Similar Stocks
Dashboard
With a Operating Losses, the company has a Weak Long Term Fundamental Strength
- Company's ability to service its debt is weak with a poor EBIT to Interest (avg) ratio of -3.77
- The company has been able to generate a Return on Equity (avg) of 4.57% signifying low profitability per unit of shareholders funds
Flat results in Mar 26
Risky - Negative EBITDA
70.91% of Promoter Shares are Pledged
Consistent Underperformance against the benchmark over the last 3 years
Stock DNA
Ferrous Metals
INR 60 Cr (Micro Cap)
NA (Loss Making)
13
0.00%
0.05
-19.57%
0.63
Total Returns (Price + Dividend) 
Latest dividend: 0.2000 per share ex-dividend date: Aug-30-2011
Risk Adjusted Returns v/s
Returns Beta

News
Facor Alloys Ltd is Rated Strong Sell
Facor Alloys Ltd is rated Strong Sell by MarketsMOJO. This rating was last updated on 13 Nov 2025, reflecting a reassessment of the stock’s outlook. However, all fundamentals, returns, and financial metrics discussed below are current as of 03 June 2026, providing investors with an up-to-date view of the company’s position.
Read full news articleAre Facor Alloys Ltd latest results good or bad?
Facor Alloys Ltd's latest financial results for Q4 FY26 highlight a company facing significant operational challenges and financial distress. The reported net sales of ₹0.13 crores reflect a substantial decline of 51.85% compared to the previous quarter and a year-on-year decrease of 23.53%. This level of revenue is concerning for a manufacturing entity, indicating potential operational paralysis, as it suggests minimal production activity. The company also reported a net loss of ₹2.10 crores for the quarter, which is a 51.95% decline from the previous quarter and a staggering 395.77% drop year-on-year. This marks the fourth consecutive quarter of losses, accumulating to approximately ₹14.80 crores for the fiscal year, further underscoring the ongoing financial difficulties. Operating margins have plunged into deeply negative territory, with an operating margin of -1653.85%, indicating severe cost structu...
Read full news article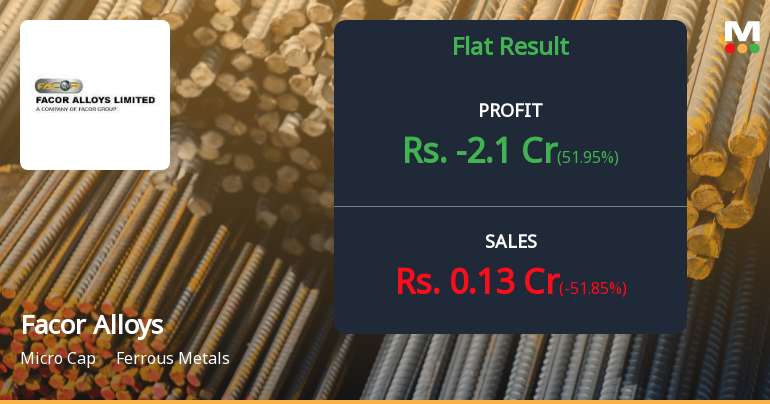
Facor Alloys Q4 FY26: Mounting Losses Signal Deepening Financial Crisis
Facor Alloys Ltd., one of India's ferro alloy producers, has reported a net loss of ₹2.10 crores for Q4 FY26, marking a deterioration of 51.95% quarter-on-quarter and a staggering 395.77% year-on-year decline. The micro-cap company, with a market capitalisation of just ₹53.78 crores, continues to struggle with operational challenges as revenue collapsed 51.85% sequentially to ₹0.13 crores, raising serious questions about business viability.
Read full news article Announcements
Compliances-Reg.24(A)-Annual Secretarial Compliance
28-May-2026 | Source : BSEAnnual Secretarial Compliance Report for the financial year ended 31st March 2026.
Considered And Approved The Financial Results For The 4Th Quarter And Year Ended March 31 2026
25-May-2026 | Source : BSEConsidered and approved the Financial Results for the 4th quarter and year ended March 31 2026
Board Meeting Outcome for Outcome Of Board Meeting
25-May-2026 | Source : BSEOutcome of Board Meeting
Corporate Actions

No Upcoming Board Meetings

Facor Alloys Ltd has declared 20% dividend, ex-date: 30 Aug 11

No Splits history available

No Bonus history available

No Rights history available
Quality key factors
Valuation key factors
Technicals key factors
 Technical Indicator Scale: Bearish, Mildly Bearish, Sideways, Mildly Bullish, Bullish Turned
 Shareholding Snapshot : Mar 2026
Shareholding Compare (%holding)
Non Institution
70.9053
Held by 2 Schemes (0.0%)
Held by 0 FIIs
Ms R B Shreeram And Co Private Limited (31.22%)
Globalscale Investments Limited (2.3%)
50.67%
Quarterly Results Snapshot (Consolidated) - Mar'26 - QoQ

QoQ Growth in quarter ended Mar 2026 is -51.85% vs -73.53% in Dec 2025
QoQ Growth in quarter ended Mar 2026 is 51.95% vs -19.07% in Dec 2025
Half Yearly Results Snapshot (Consolidated) - Sep'25
Growth in half year ended Sep 2025 is 0.00% vs -100.00% in Sep 2024
Growth in half year ended Sep 2025 is 57.97% vs -132.63% in Sep 2024
Nine Monthly Results Snapshot (Consolidated) - Dec'25
YoY Growth in nine months ended Dec 2025 is 0.00% vs -100.00% in Dec 2024
YoY Growth in nine months ended Dec 2025 is 75.06% vs -238.56% in Dec 2024
Annual Results Snapshot (Consolidated) - Mar'26

YoY Growth in year ended Mar 2026 is -99.04% vs 0.00% in Mar 2025
YoY Growth in year ended Mar 2026 is 25.67% vs 0.00% in Mar 2025
About Facor Alloys Ltd

Company Coordinates


