
Compare Faze Three with Similar Stocks
Dashboard
Company has a Debt to Equity ratio (avg) of 0.34 times
Poor long term growth as Operating profit has grown by an annual rate 5.91% of over the last 5 years
The company has declared positive results in Mar'2026 after 2 consecutive negative quarters
With ROCE of 7.4, it has a Expensive valuation with a 2.3 Enterprise value to Capital Employed
Despite the size of the company, domestic mutual funds hold only 0% of the company
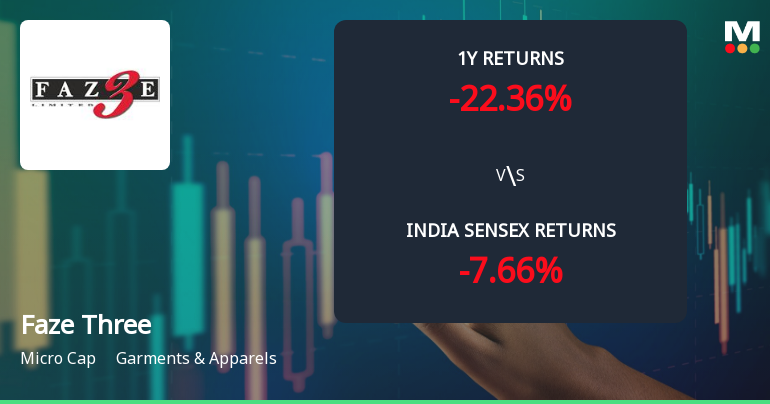
Underperformed the market in the last 1 year
Stock DNA
Garments & Apparels
INR 1,323 Cr (Micro Cap)
40.00
25
0.00%
0.54
7.42%
2.93
Total Returns (Price + Dividend) 
Latest dividend: 0.5059815950920244 per share ex-dividend date: Jun-06-2022
Risk Adjusted Returns v/s
Returns Beta

News
Faze Three Ltd Technical Momentum Shifts Amid Mixed Indicator Signals
Faze Three Ltd, a micro-cap player in the Garments & Apparels sector, has experienced a nuanced shift in its technical momentum, reflecting a complex interplay of bullish and bearish signals across multiple timeframes. Despite a recent downgrade in daily price performance, the stock’s longer-term technical indicators suggest a cautiously optimistic outlook, prompting a revision of its MarketsMOJO grade from Sell to Hold as of 15 June 2026.
Read full news article
Faze Three Ltd is Rated Hold by MarketsMOJO
Faze Three Ltd is rated 'Hold' by MarketsMOJO, with this rating last updated on 15 June 2026. However, the analysis and financial metrics discussed here reflect the company’s current position as of 19 July 2026, providing investors with the latest insights into the stock’s fundamentals, valuation, financial trends, and technical outlook.
Read full news article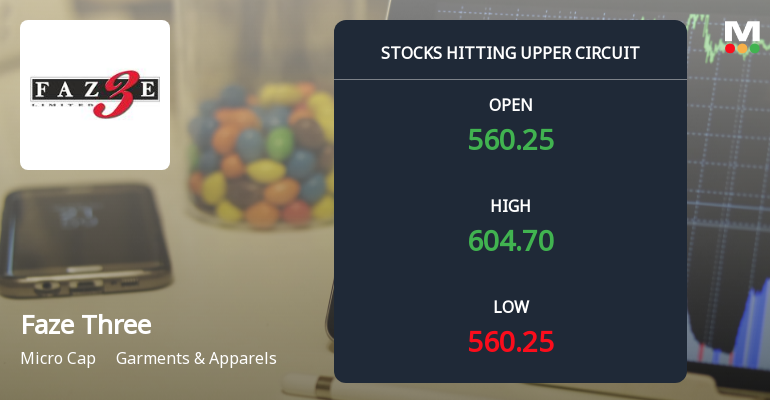
Faze Three Ltd Locks at Upper Circuit With 4.99% Gain — Buyers Queue, Sellers Absent
At Rs 600.20, the buying was done — not because demand dried up, but because the exchange wouldn't let the stock go any higher. Faze Three Ltd locked at its upper circuit of 4.99% on 9 Jul 2026, with buyers queuing and no sellers willing to part with shares.
Read full news article Announcements
Announcement under Regulation 30 (LODR)-Credit Rating
09-Jul-2026 | Source : BSEPlease find attached intimation regarding reaffirmation of Credit Rating.
Compliances-Certificate under Reg. 74 (5) of SEBI (DP) Regulations 2018
08-Jul-2026 | Source : BSEPlease refer the attached Certificate under Regulation 74 (5) of SEBI (DP) Regulations 2018.
Receipt Of Approval Under Production Linked Incentive (PLI) Scheme Of Government Of India
01-Jul-2026 | Source : BSEPlease refer the attached disclosure
Corporate Actions

No Upcoming Board Meetings

Faze Three Ltd has declared 5% dividend, ex-date: 06 Jun 22

Faze Three Ltd has announced 10:2 stock split, ex-date: 24 Oct 07

No Bonus history available

No Rights history available
Quality key factors
Valuation key factors
Technicals key factors
 Technical Indicator Scale: Bearish, Mildly Bearish, Sideways, Mildly Bullish, Bullish Turned
 Shareholding Snapshot : Jun 2026
Shareholding Compare (%holding)
Promoters
None
Held by 0 Schemes
Held by 3 FIIs (0.0%)
Ajay Brijlal Anand (34.84%)
Ajay Shrikrishan Jindal (11.56%)
35.87%
Quarterly Results Snapshot (Consolidated) - Mar'26 - QoQ

QoQ Growth in quarter ended Mar 2026 is 22.14% vs 9.64% in Dec 2025

QoQ Growth in quarter ended Mar 2026 is 206.25% vs 223.08% in Dec 2025
Half Yearly Results Snapshot (Consolidated) - Sep'25
Growth in half year ended Sep 2025 is 39.09% vs 15.00% in Sep 2024
Growth in half year ended Sep 2025 is -47.32% vs -42.43% in Sep 2024
Nine Monthly Results Snapshot (Consolidated) - Dec'25
YoY Growth in nine months ended Dec 2025 is 34.73% vs 19.80% in Dec 2024
YoY Growth in nine months ended Dec 2025 is -39.89% vs -38.31% in Dec 2024
Annual Results Snapshot (Consolidated) - Mar'26
YoY Growth in year ended Mar 2026 is 33.79% vs 22.22% in Mar 2025
YoY Growth in year ended Mar 2026 is -17.44% vs -12.73% in Mar 2025
About Faze Three Ltd

Company Coordinates


