
Compare Faze Three with Similar Stocks
Dashboard
Company has a Debt to Equity ratio (avg) of 0.34 times
Poor long term growth as Operating profit has grown by an annual rate 5.91% of over the last 5 years
The company has declared positive results in Mar'2026 after 2 consecutive negative quarters
With ROCE of 7.4, it has a Expensive valuation with a 2.4 Enterprise value to Capital Employed
Despite the size of the company, domestic mutual funds hold only 0% of the company
Stock DNA
Garments & Apparels
INR 1,390 Cr (Micro Cap)
43.00
25
0.00%
0.54
7.42%
3.22
Total Returns (Price + Dividend) 
Latest dividend: 0.5059815950920244 per share ex-dividend date: Jun-06-2022
Risk Adjusted Returns v/s
Returns Beta

News
Faze Three Ltd is Rated Hold
Faze Three Ltd is rated 'Hold' by MarketsMOJO, with this rating last updated on 15 June 2026. While the rating change occurred on that date, the analysis and financial metrics discussed here reflect the company’s current position as of 08 July 2026, providing investors with the most up-to-date view of the stock’s fundamentals, valuation, financial trends, and technical outlook.
Read full news article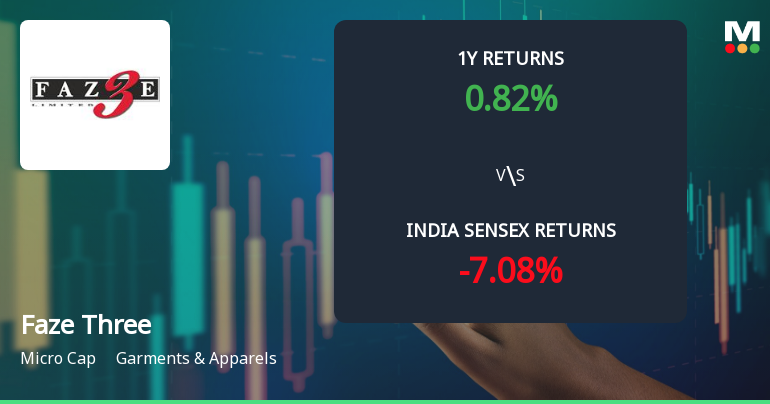
Faze Three Ltd Technical Momentum Shifts Signal Bullish Outlook Amid Micro-Cap Resurgence
Faze Three Ltd, a micro-cap player in the Garments & Apparels sector, has witnessed a notable shift in its technical momentum, upgrading its outlook from mildly bullish to bullish. This change is underpinned by a confluence of positive signals from key technical indicators including MACD, moving averages, and Bollinger Bands, despite some mixed readings from RSI and KST. The stock’s recent price action and technical upgrades coincide with robust returns that have significantly outpaced the Sensex over multiple time horizons.
Read full news article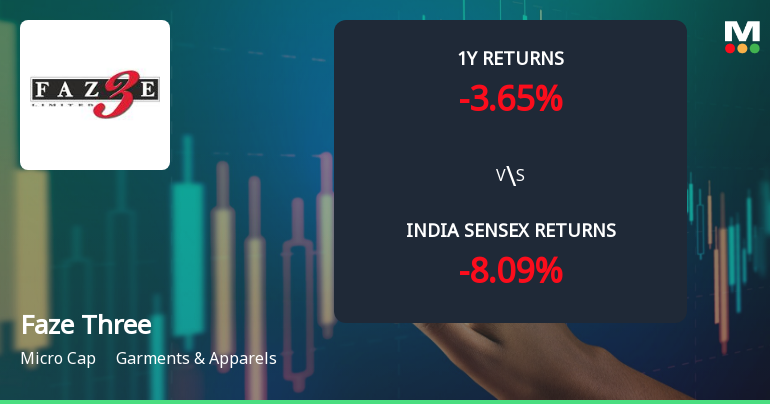
Faze Three Ltd Technical Momentum Shifts Signal Mildly Bullish Outlook
Faze Three Ltd, a micro-cap player in the Garments & Apparels sector, has recently experienced a nuanced shift in its technical momentum, moving from a bullish to a mildly bullish stance. This transition is underscored by mixed signals from key technical indicators such as MACD, RSI, and moving averages, suggesting a cautious but optimistic outlook for investors navigating this stock amid broader market dynamics.
Read full news article Announcements
Corporate Actions

No Upcoming Board Meetings

Faze Three Ltd has declared 5% dividend, ex-date: 06 Jun 22

Faze Three Ltd has announced 10:2 stock split, ex-date: 24 Oct 07

No Bonus history available

No Rights history available
Quality key factors
Valuation key factors
Technicals key factors
 Technical Indicator Scale: Bearish, Mildly Bearish, Sideways, Mildly Bullish, Bullish Turned
 Shareholding Snapshot : Mar 2026
Shareholding Compare (%holding)
Promoters
None
Held by 0 Schemes
Held by 3 FIIs (0.15%)
Ajay Brijlal Anand (34.84%)
Ajay Shrikrishan Jindal (11.56%)
35.7%
Quarterly Results Snapshot (Consolidated) - Mar'26 - QoQ

QoQ Growth in quarter ended Mar 2026 is 22.14% vs 9.64% in Dec 2025

QoQ Growth in quarter ended Mar 2026 is 206.25% vs 223.08% in Dec 2025
Half Yearly Results Snapshot (Consolidated) - Sep'25
Growth in half year ended Sep 2025 is 39.09% vs 15.00% in Sep 2024
Growth in half year ended Sep 2025 is -47.32% vs -42.43% in Sep 2024
Nine Monthly Results Snapshot (Consolidated) - Dec'25
YoY Growth in nine months ended Dec 2025 is 34.73% vs 19.80% in Dec 2024
YoY Growth in nine months ended Dec 2025 is -39.89% vs -38.31% in Dec 2024
Annual Results Snapshot (Consolidated) - Mar'26
YoY Growth in year ended Mar 2026 is 33.79% vs 22.22% in Mar 2025
YoY Growth in year ended Mar 2026 is -17.44% vs -12.73% in Mar 2025
About Faze Three Ltd

Company Coordinates


