
Compare Fedbank Financi. with Similar Stocks
Dashboard
Strong Long Term Fundamental Strength with a 24.72% CAGR growth in Operating Profits
Healthy long term growth as Net Sales has grown by an annual rate of 25.32% and Operating profit at 24.72%
The company has declared Positive results for the last 5 consecutive quarters
With ROE of 11.7, it has a Fair valuation with a 1.9 Price to Book Value
Majority shareholders : Promoters
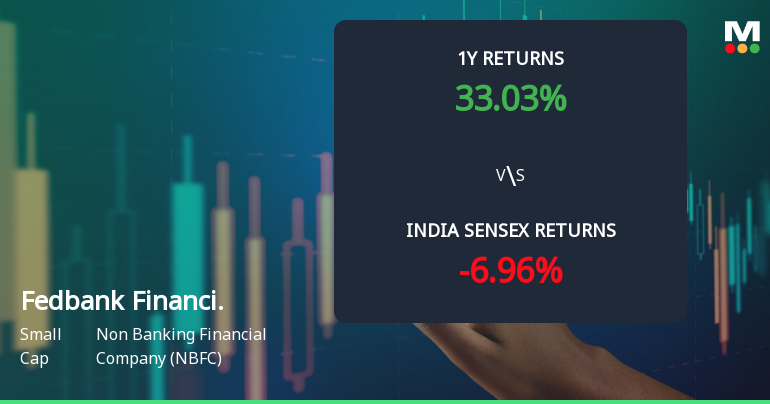
Market Beating Performance
Stock DNA
Non Banking Financial Company (NBFC)
INR 5,594 Cr (Small Cap)
16.00
21
0.00%
4.67
11.74%
1.91
Total Returns (Price + Dividend) 
Fedbank Financi. for the last several years.
Risk Adjusted Returns v/s
Returns Beta

News
Fedbank Financial Services Ltd Technical Momentum Shifts Amid Mixed Market Signals
Fedbank Financial Services Ltd has experienced a nuanced shift in its technical momentum, moving from a bullish to a mildly bullish stance. Despite a recent decline in price, key indicators such as MACD and moving averages suggest a cautiously optimistic outlook, while other metrics like KST and OBV signal underlying bearish pressures. This article analyses the evolving technical landscape of this small-cap NBFC and its implications for investors.
Read full news article
Fedbank Financial Services Ltd Technical Momentum Shifts to Bullish Amid Market Volatility
Fedbank Financial Services Ltd has experienced a notable shift in its technical momentum, moving from a mildly bullish stance to a more confident bullish trend. This change is underscored by improvements in key technical indicators such as the MACD and moving averages, signalling a potential positive trajectory despite recent price fluctuations and broader market challenges.
Read full news article
Fedbank Financial Services Ltd is Rated Hold
Fedbank Financial Services Ltd is rated 'Hold' by MarketsMOJO, with this rating last updated on 18 May 2026. However, the analysis and financial metrics discussed here reflect the stock's current position as of 21 June 2026, providing investors with the latest insights into its performance and outlook.
Read full news article Announcements
Corporate Actions

No Upcoming Board Meetings

No Dividend history available

No Splits history available

No Bonus history available

No Rights history available
Quality key factors
Valuation key factors
Technicals key factors
 Technical Indicator Scale: Bearish, Mildly Bearish, Sideways, Mildly Bullish, Bullish Turned
 Shareholding Snapshot : Mar 2026
Shareholding Compare (%holding)
Promoters
None
Held by 9 Schemes (2.71%)
Held by 30 FIIs (0.66%)
Financial Institutions / Banks (60.79%)
True North Fund Vi Llp (7.26%)
15.53%
Quarterly Results Snapshot (Standalone) - Mar'26 - QoQ

QoQ Growth in quarter ended Mar 2026 is 11.04% vs 3.70% in Dec 2025
QoQ Growth in quarter ended Mar 2026 is 14.36% vs 9.68% in Dec 2025
Half Yearly Results Snapshot (Standalone) - Sep'25

Growth in half year ended Sep 2025 is 6.23% vs 30.96% in Sep 2024
Growth in half year ended Sep 2025 is 15.12% vs 20.73% in Sep 2024
Nine Monthly Results Snapshot (Standalone) - Dec'25
YoY Growth in nine months ended Dec 2025 is 5.71% vs 29.98% in Dec 2024
YoY Growth in nine months ended Dec 2025 is 58.31% vs -13.27% in Dec 2024
Annual Results Snapshot (Standalone) - Mar'26
YoY Growth in year ended Mar 2026 is 7.84% vs 30.73% in Mar 2025
YoY Growth in year ended Mar 2026 is 52.59% vs -7.98% in Mar 2025
About Fedbank Financial Services Ltd

Company Coordinates


