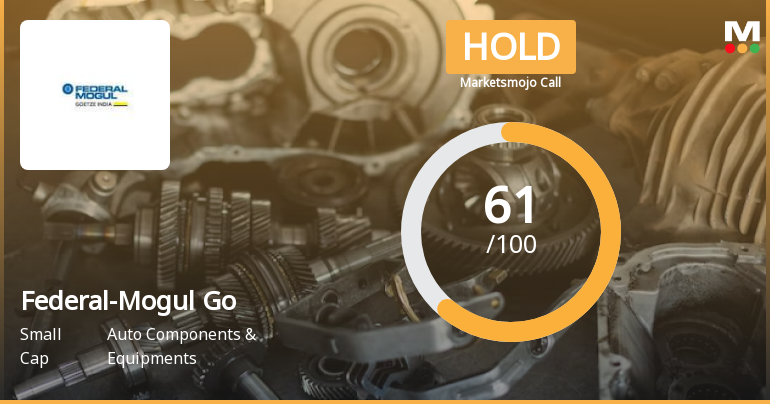
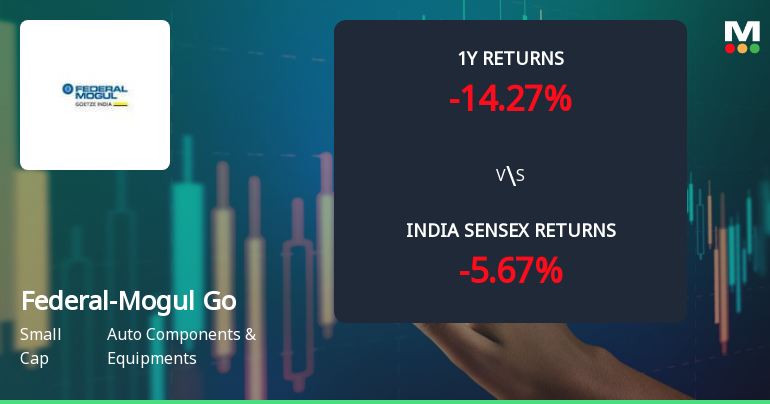
Federal-Mogul Go

  • Market Cap: Small Cap
  • Industry: Auto Components & Equipments
  • ISIN: INE529A01010
  • NSEID: FMGOETZE
  • BSEID: 505744
INR
446.15
-1.35 (-0.3%)
BSENSE

Sep 18, 03:30 PM

BSE+NSE Vol: 1.27 lacs

  • Price Points
  • Score
  • Mojo Parameters
  • Total Return
  • News and Corporate Actions
  • Key factors
  • Shareholding
  • Financials
  • CompanyCV
stock-summaryPrice Point
High/Low

1Day

52 Week

Valuation
Technical
Day's Volume

CASH

1.27 lacs (-58.73%) Volume

Shareholding (Jun 2026)

FII

0.39%

Held by 27 FIIs

DII

0.50%

Held by 0 DIIs

Promoter

74.98%

Why is Federal-Mogul Goetze (India) Ltd falling/rising?

06-Sep-2026

As of 05-Sep, Federal-Mogul Goetze (India) Ltd's stock price has significantly declined to 501.40, down 18.29%, due to poor performance and reduced investor participation. Despite being net-debt free and having a high dividend yield, the stock's recent metrics indicate a lack of investor confidence and a bearish outlook.

As of 05-Sep, Federal-Mogul Goetze (India) Ltd is experiencing a significant decline in its stock price, currently at 501.40, which reflects a change of -112.25 (-18.29%). This drop is primarily attributed to a poor performance today, where the stock opened with a loss of -16.89% and touched an intraday low of Rs 499.75, marking a decrease of -18.56%. The stock has underperformed its sector by -17.81%, indicating a broader weakness in investor sentiment.<BR><BR>In terms of trading activity, there has been a notable decrease in investor participation, with delivery volume falling by -16.44% compared to the 5-day average. Despite the stock being net-debt free and having a high dividend yield of 18.7%, the recent performance metrics suggest a lack of confidence among investors. The stock's performance over the past week shows a decline of -16.62%, while the year-to-date performance is still positive at +7.54%. However, the one-year return is negative at -10.58%, which may contribute to a bearish outlook.<BR><BR>Additionally, while the stock is trading above its longer-term moving averages (50-day, 100-day, and 200-day), it is currently below the shorter-term moving averages (5-day and 20-day), indicating a potential shift in momentum. Overall, the combination of a sharp decline in price, reduced trading volume, and underperformance relative to the sector are key factors contributing to the falling stock price of Federal-Mogul Goetze (India) Ltd.

View full answer

Who are in the management team of Federal-Mogul Go?

01-Sep-2026

The management team of Federal-Mogul Go includes K N Subramaniam (Chairman), Vinod Kumar Hans, Khalid Khan (Whole-time Directors), Manish Chadha (Executive Director - Finance), Rajesh Sinha (Executive Director & Whole-time Director), K C Sundareshan Pillai, Nalini Jolly (Independent Non-Executive Directors), and Stephen Shaun Merry (Non-Executive Director). They are responsible for the company's strategic direction and operations.

The management team of Federal-Mogul Go includes the following key individuals:<BR><BR>1. **K N Subramaniam** - Chairman & Independent Director<BR>2. **Vinod Kumar Hans** - Whole-time Director<BR>3. **Khalid Khan** - Whole-time Director<BR>4. **Manish Chadha** - Executive Director - Finance<BR>5. **Rajesh Sinha** - Executive Director & Whole-time Director<BR>6. **K C Sundareshan Pillai** - Independent Non-Executive Director<BR>7. **Nalini Jolly** - Independent Non-Executive Woman Director<BR>8. **Stephen Shaun Merry** - Non-Executive Director<BR><BR>This team plays a crucial role in guiding the company's strategic direction and operations.

View full answer

What does Federal-Mogul Go do?

01-Sep-2026

Federal-Mogul Goetze (India) Ltd is a small-cap joint venture in the auto components industry, reporting net sales of 526 Cr and a net profit of 43 Cr for June 2026. The company has a market cap of INR 3,475 Cr and key metrics include a P/E ratio of 19.00 and a return on equity of 12.80%.

Overview:<BR>Federal-Mogul Goetze (India) Ltd is a Joint Venture Company operating in the Auto Components & Equipments industry, categorized as a Small Cap company.<BR><BR>History:<BR>The company was incorporated on November 26, 1954, originally named 'Goetze (India) Limited', and was renamed to Federal-Mogul Goetze (India) Limited in May 2006. The latest quarterly results reported net sales and profit for June 2026.<BR><BR>Financial Snapshot:<BR>- Net Sales: 526 Cr (Quarterly Results - Jun 2026)<BR>- Net Profit: 43 Cr (Quarterly Results - Jun 2026)<BR>- Market Cap: INR 3,475 Cr (Small Cap)<BR><BR>Key Metrics:<BR>- P/E: 19.00<BR>- Industry P/E: 41<BR>- Dividend Yield: 0.00%<BR>- Debt Equity: -0.58<BR>- Return on Equity: 12.80%<BR>- Price to Book: 2.36<BR><BR>Contact Details:<BR>Address: DLF Prime Tower, 10 Ground Floor F-39&80 Okhla New Delhi New Delhi : 110020 <BR>Tel: 91-11-71745745 <BR>Email: investor.grievance@federalmogul.com <BR>Website: http://www.federalmogulgoetzeindia.net

View full answer

Who are the peers of the Federal-Mogul Go?

01-Sep-2026

Federal-Mogul Go's peers include Uniparts India, Divgi Torq, JTEKT India, and others, with varying management risks and growth rates. Uniparts India leads in 1-year returns at 126.09%, while Federal-Mogul Go has a return of 17.42%.

Peers: The peers of Federal-Mogul Go are Uniparts India, Divgi Torq, JTEKT India, Carraro India, Rane (Madras), MM Forgings, Sundaram Clayton, Automotive Axles, Rajratan Global, and Talbros Auto.<BR><BR>Quality Snapshot: Excellent management risk is observed at Carraro India, JTEKT India, and Automotive Axles, while Average management risk is found at Federal-Mogul Go, Uniparts India, Divgi Torq, Rane (Madras), MM Forgings, and Talbros Auto. Good growth is seen at Carraro India and the rest have Below Average growth, including Federal-Mogul Go, Uniparts India, Divgi Torq, JTEKT India, Rane (Madras), MM Forgings, Sundaram Clayton, Automotive Axles, Rajratan Global, and Talbros Auto. Excellent capital structure is noted at Uniparts India, Divgi Torq, JTEKT India, Federal-Mogul Go, and Automotive Axles, while Good capital structure is found at Carraro India and Rajratan Global, and the rest have Below Average or Average capital structures.<BR><BR>Return Snapshot: Uniparts India has the highest 1-year return at 126.09%, while JTEKT India has the lowest at -8.18%. Federal-Mogul Go's 1-year return of 17.42% is higher than JTEKT India's but lower than Uniparts India's. Additionally, Sundaram Clayton and Automotive Axles have negative six-month returns.

View full answer

How big is Federal-Mogul Go?

01-Sep-2026

As of 31st August, Federal-Mogul Goetze (India) Ltd has a market capitalization of 3,475.00 Cr, with recent net sales of 2,001.00 Cr and a net profit of 170.86 Cr over the last four quarters.

As of 31st August, <BR><BR>Market Cap: Federal-Mogul Goetze (India) Ltd has a market capitalization of 3,475.00 Cr, categorizing it as a Small Cap company.<BR><BR>Recent Quarterly Performance: The sum of Net Sales for the latest 4 quarters is 2,001.00 Cr, while the sum of Net Profit for the same period is 170.86 Cr.<BR><BR>Balance Sheet Snapshot: The reporting period for the balance sheet is March 2025. Shareholder's Funds are valued at 1,267.94 Cr, and Total Assets amount to 1,755.30 Cr.

View full answer

Should I buy, sell or hold Federal-Mogul Goetze (India) Ltd?

14-Aug-2026

When is the next results date for Federal-Mogul Goetze (India) Ltd?

05-Aug-2026

The next results date for Federal-Mogul Goetze (India) Ltd is 12 August 2026.

The next results date for Federal-Mogul Goetze (India) Ltd is scheduled for 12 August 2026.

View full answer

Are Federal-Mogul Goetze (India) Ltd latest results good or bad?

26-May-2026

Federal-Mogul Goetze (India) Ltd's latest results are mixed; while Q4 FY26 showed a year-on-year sales increase of 6.50% and a significant profit rise of 69.12% quarter-on-quarter, net profit declined 17.28% year-on-year, and operating margins contracted, indicating potential cost pressures. Overall, the full fiscal year showed better performance, but investors should remain cautious due to these mixed signals.

Federal-Mogul Goetze (India) Ltd's latest results present a mixed picture. In Q4 FY26, the company reported net sales of ₹488.58 crores, which reflects a slight sequential decline of 1.43% but a year-on-year increase of 6.50%. This indicates some resilience in revenue generation.<BR><BR>On the profit side, the net profit for the quarter was ₹49.13 crores, showing a significant quarter-on-quarter increase of 69.12%. However, this figure represents a decline of 17.28% compared to the same quarter last year, which raises concerns about profitability sustainability.<BR><BR>A notable issue is the sharp contraction in operating margins, which fell to 16.82% from 21.19% year-on-year. This decline suggests that the company is facing increasing cost pressures that are outpacing its pricing power, a critical concern in the competitive automotive supply chain.<BR><BR>For the full fiscal year FY26, the company performed better overall, achieving net sales of ₹1,800 crores, up 6.20% from the previous year, and a net profit of ₹169 crores, up 27.07%. The full-year operating margin improved to 15.80%, indicating that the challenges faced in Q4 may be more cyclical than structural.<BR><BR>In summary, while there are positive aspects such as revenue growth and improved cash position, the significant year-on-year decline in net profit and operating margin compression are concerning. Investors may want to approach the stock with caution, given the mixed signals from the latest results.

View full answer

Is Federal-Mogul Go technically bullish or bearish?

21-Nov-2025

As of November 20, 2025, the trend is mildly bullish due to mixed indicators, with monthly signals supporting bullishness while weekly indicators show some bearishness.

As of 20 November 2025, the technical trend has changed from bullish to mildly bullish. The current stance is mildly bullish, driven by a mix of indicators across different time frames. The weekly MACD is mildly bearish, while the monthly MACD remains bullish. The daily moving averages indicate a bullish trend, and the monthly Bollinger Bands are also bullish. However, the weekly KST is mildly bearish, and Dow Theory shows a mildly bullish stance on the weekly but mildly bearish on the monthly. Overall, the mixed signals suggest a cautious bullish outlook, with strength primarily from the monthly indicators.

View full answer

How has been the historical performance of Federal-Mogul Go?

20-Nov-2025

Federal-Mogul Go has shown consistent growth from March 2020 to March 2025, with net sales increasing from 1,085.41 Cr to 1,800.19 Cr, and profit after tax rising from 4.94 Cr to 169.88 Cr, indicating strong profitability and operational efficiency. Total assets and liabilities grew proportionally, while cash flow from operating activities improved to 220.00 Cr.

Answer:<BR>The historical performance of Federal-Mogul Go shows a consistent growth trend in net sales and profitability over the years leading up to March 2025.<BR><BR>Breakdown:<BR>Federal-Mogul Go's net sales have increased from 1,085.41 Cr in March 2020 to 1,800.19 Cr in March 2025, reflecting a steady upward trajectory. The total operating income has similarly risen, reaching 1,800.19 Cr in March 2025, up from 1,085.41 Cr in March 2020. The company has managed to improve its operating profit (PBDIT) from 125.38 Cr in March 2021 to 328.25 Cr in March 2025, indicating enhanced operational efficiency. Profit before tax has also shown significant growth, climbing from 7.90 Cr in March 2021 to 234.87 Cr in March 2025. Consequently, profit after tax has risen from 4.94 Cr in March 2021 to 169.88 Cr in March 2025, demonstrating strong profitability. The earnings per share (EPS) have increased substantially from 0.1 in March 2021 to 29.13 in March 2025, reflecting improved shareholder value. On the balance sheet, total assets grew from 1,175.37 Cr in March 2020 to 1,755.30 Cr in March 2025, while total liabilities increased from 1,175.37 Cr to 1,755.30 Cr in the same period, indicating a proportional growth in both assets and liabilities. The cash flow from operating activities has also improved, reaching 220.00 Cr in March 2025, compared to 191.00 Cr in March 2020, highlighting better cash generation capabilities. Overall, Federal-Mogul Go has demonstrated robust growth in sales, profits, and cash flow, positioning itself favorably in the market.

View full answer

Is Federal-Mogul Go overvalued or undervalued?

13-Aug-2025

As of August 12, 2025, Federal-Mogul Go is considered fairly valued with a PE ratio of 16.41, an EV to EBITDA of 7.46, and a ROCE of 29.79%, showing a more favorable valuation compared to peers like Bosch and Samvardhana Motherson, despite recent underperformance against the Sensex, while achieving a strong year-to-date return of 32.64%.

As of 12 August 2025, the valuation grade for Federal-Mogul Go has moved from very attractive to attractive. The company is currently considered fairly valued. Key ratios include a PE ratio of 16.41, an EV to EBITDA of 7.46, and a ROCE of 29.79%. <BR><BR>In comparison to its peers, Federal-Mogul Go's PE ratio is significantly lower than Bosch, which stands at 51.35, and Samvardhana Motherson, at 25.05, indicating a more favorable valuation in the context of its earnings potential. While the stock has underperformed relative to the Sensex over the past week and month, it has shown a strong year-to-date return of 32.64%, suggesting robust performance in the longer term.

View full answer

Who are the top shareholders of the Federal-Mogul Go?

17-Jul-2025

The top shareholders of Federal-Mogul Go include Federal Mogul Holdings Ltd. with 60.05%, Rajasthan Global Securities Private Limited at 3.19%, and individual investors holding 16.4%. Additionally, 23 foreign institutional investors hold 0.3%, while four mutual funds have 0.0% holdings, with no pledged promoter shares reported.

The top shareholders of Federal-Mogul Go include Federal Mogul Holdings Ltd., which holds a significant 60.05% of the shares. Other notable shareholders include Rajasthan Global Securities Private Limited, with a holding of 3.19%. Additionally, individual investors collectively own 16.4% of the company. There are also 23 foreign institutional investors (FIIs) with a combined holding of 0.3%, and four mutual funds that hold 0.0%. Overall, the majority of the shares are held by promoters, with no pledged promoter holdings reported.

View full answer

Has Federal-Mogul Go declared dividend?

06-Jun-2025

No Dividend History Available

iScoreScore
Click here to find our call on this stock
Strong Sell
Sell
Hold
Buy
Strong Buy

Dashboard

1

The company is Net-Debt Free

 
2

Poor long term growth as Net Sales has grown by an annual rate of 8.54% and Operating profit at 13.66% over the last 5 years

 
3

Flat results in Jun 26

4

With ROE of 12.8, it has a Very Attractive valuation with a 1.7 Price to Book Value

5

Despite the size of the company, domestic mutual funds hold only 0.01% of the company

6

Underperformed the market in the last 1 year

stock-summaryMojo Parameters

Mojo Parameters

Loading Valuation Snapshot...

Stock DNA

stock-summary
Industry

Auto Components & Equipments

stock-summary
Market cap

INR 2,510 Cr (Small Cap)

stock-summary
P/E

13.00

stock-summary
Industry P/E

39

stock-summary
Dividend Yield

21.01%

stock-summary
Debt Equity

-0.58

stock-summary
Return on Equity

12.80%

stock-summary
Price to Book

1.73

Revenue and Profits:
Net Sales:
526 Cr
(Quarterly Results - Jun 2026)
Net Profit:
43 Cr
stock-summaryTotal Returns
Total Returns (Price + Dividend) stock-summary
Dividend Yield (21.01%)
TimePeriod
Price Return
Dividend Return
Total Return
3 Months
1.06%
18.27%
19.33%
6 Months
11.57%
23.97%
35.54%
1 Year
-19.29%
15.79%
-3.5%
2 Years
-2.78%
19.47%
16.69%
3 Years
21.53%
24.30%
45.83%
4 Years
48.47%
25.21%
73.68%
5 Years
59.45%
31.22%
90.67%

Latest dividend: 86.5 per share ex-dividend date: Sep-04-2026

Risk Adjusted Returns v/s stock-summary
Returns Beta
Icon
Beta has not been calculated since enough price history is not available
stock-summaryNews & Corporate Actions

News

Announcements stock-summary

Federal-Mogul Goetze (India) Limited. - Clarification

27-Nov-2019 | Source : NSE

Federal-Mogul Goetze (India) Limited.ted. with respect to announcement dated 31-Oct-2019, regarding Resignation of Mr Mahendra Kumar Goyal as Non- Executive Independent Director of the company w.e.f. October 31, 2019. On basis of above the Company is required to clarify following: 1. Clarification from resigning independent Director that there are no other material reasons other than provided. The response of the Company is awaited.

Federal-Mogul Goetze (India) Limited. - Reply to Clarification- Financial results

14-Nov-2019 | Source : NSE

Federal-Mogul Goetze (India) Limited.ral-Mogul Goetze (India) Limited. for the quarter ended 30-Sep-2019 with respect to Regulation 33 of the SEBI (Listing Obligations and Disclosure Requirements) Regulations, 2015.

Federal-Mogul Goetze (India) Limited. - Clarification - Financial Results

13-Nov-2019 | Source : NSE

Federal-Mogul Goetze (India) Limited.l Goetze (India) Limited. for the quarter ended 30-Sep-2019 with respect to Regulation 33 of the SEBI (Listing Obligations and Disclosure Requirements) Regulations, 2015.

Corporate Actions stock-summary

stock-summary
BOARD MEETING

No Upcoming Board Meetings

stock-summary
DIVIDEND

Federal-Mogul Goetze (India) Ltd has declared 75% dividend, ex-date: 04 Sep 26

stock-summary
SPLITS

No Splits history available

stock-summary
BONUS

No Bonus history available

stock-summary
RIGHTS

Federal-Mogul Goetze (India) Ltd has announced 71:100 rights issue, ex-date: 03 Nov 08

stock-summaryKey Factors

Quality key factors stock-summary

Factor
Value
Sales Growth (5y)
8.54%
EBIT Growth (5y)
13.66%
EBIT to Interest (avg)
29.17
Debt to EBITDA (avg)
Net Debt is too low
Net Debt to Equity (avg)
-0.58
Sales to Capital Employed (avg)
1.51
Tax Ratio
26.03%
Dividend Payout Ratio
0
Pledged Shares
0
Institutional Holding
0.88%
ROCE (avg)
23.02%
ROE (avg)
10.69%

Valuation key factors

Factor
Value
P/E Ratio
13
Industry P/E
39
Price to Book Value
1.72
EV to EBIT
7.71
EV to EBITDA
5.48
EV to Capital Employed
2.70
EV to Sales
0.82
PEG Ratio
1.59
Dividend Yield
21.18%
ROCE (Latest)
35.34%
ROE (Latest)
12.80%

Technicals key factors

Indicator
Weekly
Monthly
MACD
Mildly Bearish
Bullish
RSI
No Signal
No Signal
Bollinger Bands
Bearish
Bearish
Moving Averages
Mildly Bullish (Daily)
KST
Bullish
Mildly Bearish
Dow Theory
No Trend
Mildly Bullish
OBV
No Trend
Bullish
stock-summary Technical Indicator Scale: Bearish, Mildly Bearish, Sideways, Mildly Bullish, Bullish  Turned 
stock-summaryShareholding
Shareholding Snapshot : Jun 2026stock-summary
Shareholding Compare (%holding) stock-summary
Majority shareholders

Promoters

Pledged Promoter Holdings

None

Mutual Funds

Held by 5 Schemes (0.0%)

FIIs

Held by 27 FIIs (0.39%)

Promoter with highest holding

Federal Mogul Holdings Ltd. (60.05%)

Highest Public shareholder

Rajasthan Global Securities Private Limited (3.05%)

Individual Investors Holdings

16.79%

stock-summaryFinancial
[
  {
    "link": "quarterly",
    "btn_text": "All Quarterly Results",
    "header": "Quarterly Results Snapshot (Consolidated) - Jun'26 - YoY",
    "rhs": [
      {
        "prefix": "Net Sales ",
        "suffix": "YoY Growth in quarter ended Jun 2026 is 8.81% vs 8.78% in Jun 2025",
        "dir": 1
      },
      {
        "prefix": "Consolidated Net Profit ",
        "suffix": "YoY Growth in quarter ended Jun 2026 is 0.49% vs 21.87% in Jun 2025",
        "dir": -1
      }
    ],
    "table": {
      "header": [
        "Jun'26",
        "Jun'25",
        "Change(%)"
      ],
      "body": [
        {
          "field": "Net Sales",
          "val1": "526.27",
          "val2": "483.67",
          "chgp": "8.81%",
          "chgp_class": "positive"
        },
        {
          "field": "Operating Profit (PBDIT) excl Other Income",
          "val1": "67.48",
          "val2": "70.58",
          "chgp": "-4.39%",
          "chgp_class": "negative"
        },
        {
          "field": "Interest",
          "val1": "2.38",
          "val2": "0.95",
          "chgp": "150.53%",
          "chgp_class": "negative"
        },
        {
          "field": "Exceptional Items",
          "val1": "0.00",
          "val2": "0.00",
          "chgp": "",
          "chgp_class": "neutral"
        },
        {
          "field": "Consolidate Net Profit",
          "val1": "43.46",
          "val2": "43.25",
          "chgp": "0.49%",
          "chgp_class": "positive"
        },
        {
          "field": "Operating Profit Margin (Excl OI)",
          "val1": "12.82%",
          "val2": "14.59%",
          "chgp": "-1.77%",
          "chgp_class": "negative"
        }
      ]
    }
  },
  {
    "link": "half-yearly",
    "btn_text": "All Half Yearly Results",
    "header": "Half Yearly Results Snapshot (Consolidated) - Sep'25",
    "rhs": [
      {
        "prefix": "Net Sales ",
        "suffix": " Growth in half year ended Sep 2025 is 7.24% vs 6.49% in Sep 2024",
        "dir": 1
      },
      {
        "prefix": "Consolidated Net Profit ",
        "suffix": " Growth in half year ended Sep 2025 is 25.42% vs 18.79% in Sep 2024",
        "dir": 1
      }
    ],
    "table": {
      "header": [
        "Sep'25",
        "Sep'24",
        "Change(%)"
      ],
      "body": [
        {
          "field": "Net Sales",
          "val1": "974.17",
          "val2": "908.36",
          "chgp": "7.24%",
          "chgp_class": "positive"
        },
        {
          "field": "Operating Profit (PBDIT) excl Other Income",
          "val1": "152.18",
          "val2": "131.98",
          "chgp": "15.31%",
          "chgp_class": "positive"
        },
        {
          "field": "Interest",
          "val1": "2.53",
          "val2": "2.34",
          "chgp": "8.12%",
          "chgp_class": "negative"
        },
        {
          "field": "Exceptional Items",
          "val1": "0.00",
          "val2": "0.00",
          "chgp": "",
          "chgp_class": "neutral"
        },
        {
          "field": "Consolidate Net Profit",
          "val1": "92.47",
          "val2": "73.73",
          "chgp": "25.42%",
          "chgp_class": "positive"
        },
        {
          "field": "Operating Profit Margin (Excl OI)",
          "val1": "15.62%",
          "val2": "14.53%",
          "chgp": "1.09%",
          "chgp_class": "positive"
        }
      ]
    }
  },
  {
    "link": "nine-monthly",
    "btn_text": "All Nine Monthly Results",
    "header": "Nine Monthly Results Snapshot (Consolidated) - Dec'25",
    "rhs": [
      {
        "prefix": "Net Sales ",
        "suffix": "YoY Growth in nine months ended Dec 2025 is 9.57% vs 5.81% in Dec 2024",
        "dir": 1
      },
      {
        "prefix": "Consolidated Net Profit ",
        "suffix": "YoY Growth in nine months ended Dec 2025 is 18.39% vs 18.59% in Dec 2024",
        "dir": -1
      }
    ],
    "table": {
      "header": [
        "Dec'25",
        "Dec'24",
        "Change(%)"
      ],
      "body": [
        {
          "field": "Net Sales",
          "val1": "1,469.82",
          "val2": "1,341.45",
          "chgp": "9.57%",
          "chgp_class": "positive"
        },
        {
          "field": "Operating Profit (PBDIT) excl Other Income",
          "val1": "220.60",
          "val2": "187.11",
          "chgp": "17.90%",
          "chgp_class": "positive"
        },
        {
          "field": "Interest",
          "val1": "4.92",
          "val2": "3.73",
          "chgp": "31.90%",
          "chgp_class": "negative"
        },
        {
          "field": "Exceptional Items",
          "val1": "-15.06",
          "val2": "0.00",
          "chgp": "",
          "chgp_class": "neutral"
        },
        {
          "field": "Consolidate Net Profit",
          "val1": "121.52",
          "val2": "102.64",
          "chgp": "18.39%",
          "chgp_class": "positive"
        },
        {
          "field": "Operating Profit Margin (Excl OI)",
          "val1": "15.01%",
          "val2": "13.95%",
          "chgp": "1.06%",
          "chgp_class": "positive"
        }
      ]
    }
  },
  {
    "link": "annual",
    "btn_text": "All Annual Results",
    "header": "Annual Results Snapshot (Consolidated) - Mar'26",
    "rhs": [
      {
        "prefix": "Net Sales ",
        "suffix": "YoY Growth in year ended Mar 2026 is 8.79% vs 6.17% in Mar 2025",
        "dir": 1
      },
      {
        "prefix": "Consolidated Net Profit ",
        "suffix": "YoY Growth in year ended Mar 2026 is 5.33% vs 27.70% in Mar 2025",
        "dir": -1
      }
    ],
    "table": {
      "header": [
        "Mar'26",
        "Mar'25",
        "Change(%)"
      ],
      "body": [
        {
          "field": "Net Sales",
          "val1": "1,958.40",
          "val2": "1,800.19",
          "chgp": "8.79%",
          "chgp_class": "positive"
        },
        {
          "field": "Operating Profit (PBDIT) excl Other Income",
          "val1": "302.77",
          "val2": "284.32",
          "chgp": "6.49%",
          "chgp_class": "positive"
        },
        {
          "field": "Interest",
          "val1": "7.22",
          "val2": "5.89",
          "chgp": "22.58%",
          "chgp_class": "negative"
        },
        {
          "field": "Exceptional Items",
          "val1": "-17.53",
          "val2": "0.00",
          "chgp": "",
          "chgp_class": "neutral"
        },
        {
          "field": "Consolidate Net Profit",
          "val1": "170.66",
          "val2": "162.03",
          "chgp": "5.33%",
          "chgp_class": "positive"
        },
        {
          "field": "Operating Profit Margin (Excl OI)",
          "val1": "15.46%",
          "val2": "15.79%",
          "chgp": "-0.33%",
          "chgp_class": "negative"
        }
      ]
    }
  }
]

Quarterly Results Snapshot (Consolidated) - Jun'26 - YoYstock-summary

Jun'26
Jun'25
Change(%)
Net Sales
526.27
483.67
8.81%
Operating Profit (PBDIT) excl Other Income
67.48
70.58
-4.39%
Interest
2.38
0.95
150.53%
Exceptional Items
0.00
0.00
Consolidate Net Profit
43.46
43.25
0.49%
Operating Profit Margin (Excl OI)
12.82%
14.59%
-1.77%
Values in Rs Cr.
Direction Arrows
Net Sales

YoY Growth in quarter ended Jun 2026 is 8.81% vs 8.78% in Jun 2025

Direction Arrows
Consolidated Net Profit

YoY Growth in quarter ended Jun 2026 is 0.49% vs 21.87% in Jun 2025

Half Yearly Results Snapshot (Consolidated) - Sep'25stock-summary

Sep'25
Sep'24
Change(%)
Net Sales
974.17
908.36
7.24%
Operating Profit (PBDIT) excl Other Income
152.18
131.98
15.31%
Interest
2.53
2.34
8.12%
Exceptional Items
0.00
0.00
Consolidate Net Profit
92.47
73.73
25.42%
Operating Profit Margin (Excl OI)
15.62%
14.53%
1.09%
Values in Rs Cr.
Direction Arrows
Net Sales

Growth in half year ended Sep 2025 is 7.24% vs 6.49% in Sep 2024

Direction Arrows
Consolidated Net Profit

Growth in half year ended Sep 2025 is 25.42% vs 18.79% in Sep 2024

Nine Monthly Results Snapshot (Consolidated) - Dec'25stock-summary

Dec'25
Dec'24
Change(%)
Net Sales
1,469.82
1,341.45
9.57%
Operating Profit (PBDIT) excl Other Income
220.60
187.11
17.90%
Interest
4.92
3.73
31.90%
Exceptional Items
-15.06
0.00
Consolidate Net Profit
121.52
102.64
18.39%
Operating Profit Margin (Excl OI)
15.01%
13.95%
1.06%
Values in Rs Cr.
Direction Arrows
Net Sales

YoY Growth in nine months ended Dec 2025 is 9.57% vs 5.81% in Dec 2024

Direction Arrows
Consolidated Net Profit

YoY Growth in nine months ended Dec 2025 is 18.39% vs 18.59% in Dec 2024

Annual Results Snapshot (Consolidated) - Mar'26stock-summary

Mar'26
Mar'25
Change(%)
Net Sales
1,958.40
1,800.19
8.79%
Operating Profit (PBDIT) excl Other Income
302.77
284.32
6.49%
Interest
7.22
5.89
22.58%
Exceptional Items
-17.53
0.00
Consolidate Net Profit
170.66
162.03
5.33%
Operating Profit Margin (Excl OI)
15.46%
15.79%
-0.33%
Values in Rs Cr.
Direction Arrows
Net Sales

YoY Growth in year ended Mar 2026 is 8.79% vs 6.17% in Mar 2025

Direction Arrows
Consolidated Net Profit

YoY Growth in year ended Mar 2026 is 5.33% vs 27.70% in Mar 2025

stock-summaryCompany CV
About Federal-Mogul Goetze (India) Ltd stock-summary
stock-summary
Federal-Mogul Goetze (India) Ltd
Small Cap
Auto Components & Equipments
Federal-Mogul Goetze (India) Limited is a Joint Venture Company of Federal Mogul in India. The Company was erstwhile incorporated on November 26, 1954 in the name of 'Goetze (India) Limited'. The Company's name was later changed from 'Goetze (India) Limited' to Federal-Mogul Goetze (India) Limited in May, 2006. Federal-Mogul Goetze (India) Ltd. is a Joint Venture Company of Federal Mogul in India.
Company Coordinates stock-summary
Company Details
DLF Prime Tower, 10 Ground Floor F-39&80 Okhla New Delhi New Delhi : 110020
stock-summary
Tel: 91-11-71745745
stock-summary
investor.grievance@federalmogul.com
Registrar Details
Alankit Assignments Ltd , Alankit House , 2 E/21, Jhandewala Extension, New Delhi