
Compare Fermenta Biotec. with Similar Stocks
Dashboard
Weak Long Term Fundamental Strength with an average Return on Capital Employed (ROCE) of 8.88%
- Poor long term growth as Net Sales has grown by an annual rate of 6.85% and Operating profit at 4.95% over the last 5 years
With a fall in Net Sales of -13.06%, the company declared Very Negative results in Mar 26
Despite the size of the company, domestic mutual funds hold only 0% of the company
Stock DNA
Pharmaceuticals & Biotechnology
INR 1,048 Cr (Micro Cap)
15.00
35
0.71%
0.18
16.45%
2.57
Total Returns (Price + Dividend) 
Latest dividend: 2.5 per share ex-dividend date: Aug-06-2025
Risk Adjusted Returns v/s
Returns Beta

News

Golden Cross Forms in Fermenta Biotech Ltd — On a Day the Stock Fell 1.00%. What the Mixed Signals Mean
The 50-day moving average has crossed above the 200-day moving average for Fermenta Biotech Ltd, signalling a golden cross on 2 Jul 2026. Yet, the stock declined 1.00% on the same day, while monthly momentum indicators remain mildly bearish. This juxtaposition of signals calls for a detailed examination of the technical and fundamental backdrop to assess the signal's reliability.
Read full news article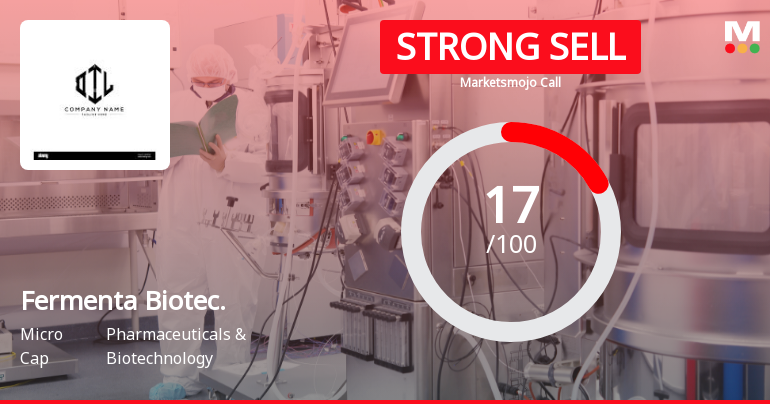
Fermenta Biotech Downgraded to Strong Sell Amid Weak Financials and Bearish Technicals
Fermenta Biotech Ltd has been downgraded from a Sell to a Strong Sell rating as of 1 July 2026, reflecting deteriorating fundamentals and a shift in technical indicators. The micro-cap pharmaceutical company’s recent quarterly results, valuation metrics, and technical trends have collectively triggered this reassessment, signalling caution for investors amid ongoing challenges.
Read full news article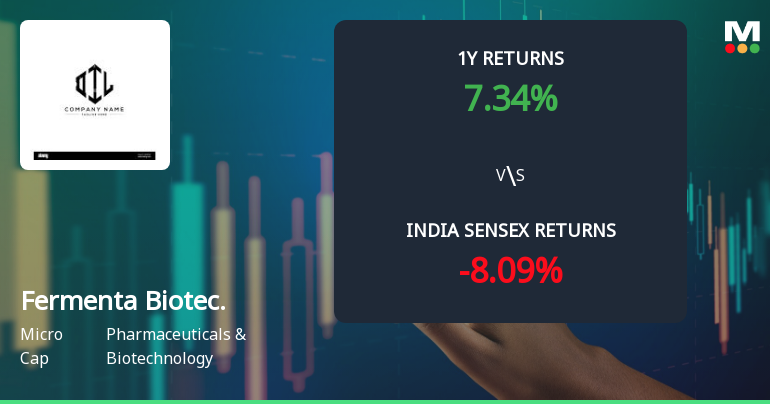
Fermenta Biotech Ltd Technical Momentum Shifts Amid Mixed Market Signals
Fermenta Biotech Ltd has experienced a subtle but notable shift in its technical momentum, moving from a mildly bullish stance to a mildly bearish outlook. Despite a marginal day decline of 0.11%, the stock’s technical indicators present a complex picture, with weekly and monthly signals diverging across key metrics such as MACD, RSI, and moving averages. This nuanced technical landscape warrants a detailed analysis for investors seeking clarity on the stock’s near-term trajectory within the Pharmaceuticals & Biotechnology sector.
Read full news article Announcements
Closure of Trading Window
29-Jun-2026 | Source : BSENotice of the closure of Trading window.
Announcement under Regulation 30 (LODR)-Press Release / Media Release
25-Jun-2026 | Source : BSEPress release regarding the Company being ranked 7th nationwide in the Top 50 category as part of Indias Great Mid-size workplaces 2026 by Great Place To Work.
Announcement under Regulation 30 (LODR)-Newspaper Publication
24-Jun-2026 | Source : BSENewspaper publication for notice for special window for transfer and dematerialisation of physical securities.
Corporate Actions

No Upcoming Board Meetings

Fermenta Biotech Ltd has declared 50% dividend, ex-date: 06 Aug 25

Fermenta Biotech Ltd has announced 5:5 stock split, ex-date: 08 Aug 18

Fermenta Biotech Ltd has announced 2:1 bonus issue, ex-date: 13 Feb 20

No Rights history available
Quality key factors
Valuation key factors
Technicals key factors
 Technical Indicator Scale: Bearish, Mildly Bearish, Sideways, Mildly Bullish, Bullish Turned
 Shareholding Snapshot : Mar 2026
Shareholding Compare (%holding)
Promoters
None
Held by 2 Schemes (0.0%)
Held by 2 FIIs (0.02%)
Krishna Datla (36.04%)
Rakesh Kantilal Shah (1.84%)
28.8%
Quarterly Results Snapshot (Consolidated) - Mar'26 - YoY

YoY Growth in quarter ended Mar 2026 is -13.06% vs 43.67% in Mar 2025
YoY Growth in quarter ended Mar 2026 is -44.20% vs 595.53% in Mar 2025
Half Yearly Results Snapshot (Consolidated) - Sep'25

Growth in half year ended Sep 2025 is 53.90% vs 24.25% in Sep 2024
Growth in half year ended Sep 2025 is 632.19% vs 121.41% in Sep 2024
Nine Monthly Results Snapshot (Consolidated) - Dec'25
YoY Growth in nine months ended Dec 2025 is 22.52% vs 38.31% in Dec 2024
YoY Growth in nine months ended Dec 2025 is 25.71% vs 363.46% in Dec 2024
Annual Results Snapshot (Consolidated) - Mar'26
YoY Growth in year ended Mar 2026 is 11.92% vs 39.87% in Mar 2025
YoY Growth in year ended Mar 2026 is -6.62% vs 433.30% in Mar 2025
About Fermenta Biotech Ltd

Company Coordinates


