Themis Medicare

  • Market Cap: Micro Cap
  • Industry: Pharmaceuticals & Biotechnology
  • ISIN: INE083B01024
  • NSEID: THEMISMED
  • BSEID: 530199
INR
123.45
-0.6 (-0.48%)
BSENSE

Sep 22, 03:30 PM

BSE+NSE Vol: 65.34 k

  • Price Points
  • Score
  • Mojo Parameters
  • Total Return
  • News and Corporate Actions
  • Key factors
  • Shareholding
  • Financials
  • CompanyCV
stock-summaryPrice Point
High/Low

1Day

52 Week

Valuation
Technical
Day's Volume

CASH

65.34 k (-10.81%) Volume

Shareholding (Jun 2026)

FII

0.01%

Held by 3 FIIs

DII

0.01%

Held by 0 DIIs

Promoter

67.11%

Why is Themis Medicare Ltd falling/rising?

06-Sep-2026

As of 05-Sep, Themis Medicare Ltd's stock price is at 120.60, down 3.17% after recent gains, and has underperformed its sector. The stock showed volatility during intraday trading, with decreased investor participation and a significant drop in delivery volume.

As of 05-Sep, Themis Medicare Ltd's stock price is falling, currently at 120.60, which reflects a decrease of 3.95 or 3.17%. This decline comes after a brief period of gains, as the stock has fallen following two consecutive days of increases. Additionally, the stock underperformed its sector by 1.6% today. <BR><BR>Intraday trading showed volatility, with the stock reaching a high of Rs 127.65, but it also dipped to a low of Rs 119.9. The weighted average price indicates that more volume was traded closer to this lower price, suggesting a lack of strong buying interest. Furthermore, there has been a notable decrease in investor participation, with delivery volume dropping by 51.96% compared to the 5-day average. <BR><BR>Despite some positive performance over longer periods, such as a 19.82% increase year-to-date, the current trend and day’s performance indicate a downward movement in the stock price.

View full answer

Who are in the management team of Themis Medicare?

01-Sep-2026

Themis Medicare's management team includes key individuals such as Sachin D Patel (Managing Director and CEO), Dinesh S Patel (Chairman), and several independent directors like Vijay Gopi Kishan Agarwal and Hari Subramaniam, ensuring a mix of executive leadership and independent oversight.

Themis Medicare has a diverse management team that includes several key individuals:<BR><BR>1. **Rajneesh Anand** - Non-Executive & Non-Independent Director<BR>2. **Vijay Gopi Kishan Agarwal** - Independent Non-Executive Director<BR>3. **Hari Subramaniam** - Independent Non-Executive Director<BR>4. **Reena S Patel** - Non-Executive Director<BR>5. **Sachin D Patel** - Executive Director, Managing Director, CEO, and Promoter<BR>6. **Dinesh S Patel** - Chairman & Independent Director<BR>7. **Manjul Sandhu** - Independent Non-Executive Director<BR>8. **Bhaskar Vemban Iyer** - Independent Non-Executive Director<BR>9. **Shishir Dalal** - Additional Director<BR>10. **Reena S Patel** - Alternate Director<BR><BR>This team brings a mix of executive and independent oversight to the company, contributing to its governance and strategic direction.

View full answer

What does Themis Medicare do?

01-Sep-2026

Themis Medicare Ltd, a Micro Cap company in the Pharmaceuticals & Biotechnology sector, reported net sales of 87 Cr and a net profit of 25 Cr for June 2026. Founded in 1969, it focuses on pharmaceutical products and has a market cap of INR 1,156 Cr.

Overview: <BR>Themis Medicare Ltd operates in the Pharmaceuticals & Biotechnology industry and is classified as a Micro Cap company.<BR><BR>History: <BR>Themis Medicare Limited was incorporated in 1969 as 'Themis Chemicals Limited'. The company underwent a name change in 2001 and reported its most recent quarterly results for June 2026, with net sales and profit figures.<BR><BR>Financial Snapshot: <BR>Net Sales: 87 Cr (Quarterly Results - Jun 2026) <BR>Net Profit: 25 Cr (Quarterly Results - Jun 2026) <BR>Market Cap: INR 1,156 Cr (Micro Cap)<BR><BR>Key Metrics: <BR>P/E: N/A <BR>Industry P/E: 37 <BR>Dividend Yield: 0.40% <BR>Debt-Equity: 0.23 <BR>Return on Equity: 0.50% <BR>Price to Book: 2.91<BR><BR>Contact Details: <BR>Address: Plot No 69 A GIDC Indl Estate, Vapi Valsad Gujarat : 396195 <BR>Tel: 91-260-2421675 <BR>Email: themis@themismedicare.com <BR>Website: http://www.themismedicare.com

View full answer

Who are the peers of the Themis Medicare?

01-Sep-2026

Themis Medicare's peers include Amrutanjan Health, Fermenta Biotec, Sigachi Industries, Lincoln Pharma, Bajaj Healthcare, Kopran, Bharat Parenter, Wanbury, Remus Pharma, and Accent Microcell. In terms of management risk, growth, and capital structure, Amrutanjan Health and Kopran show excellent management risk, while Themis Medicare has below-average growth and capital structure.

Peers: Themis Medicare's peers include Amrutanjan Healt, Fermenta Biotec., Sigachi Indust., Lincoln Pharma., Bajaj Healthcare, Kopran, Bharat Parenter., Wanbury, Remus Pharma, and Accent Microcell.<BR><BR>Quality Snapshot: Excellent management risk is observed at Amrutanjan Healt and Kopran, while Average management risk is found at Fermenta Biotec., Sigachi Indust., Lincoln Pharma., Bajaj Healthcare, Wanbury, and Remus Pharma, and the rest. Below Average management risk is noted for Bharat Parenter. Growth is Below Average for Amrutanjan Healt, Fermenta Biotec., Sigachi Indust., Lincoln Pharma., Themis Medicare, Bajaj Healthcare, Kopran, Bharat Parenter., Wanbury, and the rest, while Remus Pharma shows Good growth. Capital Structure is Excellent for Amrutanjan Healt, Sigachi Indust., and Lincoln Pharma, Good for Kopran, and Below Average for Themis Medicare, Bajaj Healthcare, Bharat Parenter., Wanbury, and the rest.<BR><BR>Return Snapshot: The peer with the highest 1-year return is Fermenta Biotec. at 57.50%, while the lowest is Amrutanjan Healt at -26.26%. Themis Medicare's 1-year return of 26.14% is higher than Amrutanjan Healt's but lower than Fermenta Biotec's. Additionally, Wanbury is the only peer with a negative six-month return.

View full answer

How big is Themis Medicare?

01-Sep-2026

As of 31st August, Themis Medicare Ltd has a market capitalization of 1,156.00 Cr, classifying it as a Micro Cap company, with recent net sales of 331.61 Cr and a net profit of 39.97 Cr.

As of 31st August, Themis Medicare Ltd has a market capitalization of 1,156.00 Cr, which classifies it as a Micro Cap company.<BR><BR>In the latest four quarters, Themis Medicare reported Net Sales of 331.61 Cr and a Net Profit of 39.97 Cr.<BR><BR>The latest annual period for the balance sheet is March 2025, showing Shareholder's Funds of 402.60 Cr and Total Assets of 588.03 Cr.

View full answer

Should I buy, sell or hold Themis Medicare Ltd?

01-Sep-2026

Are Themis Medicare Ltd latest results good or bad?

29-May-2026

Themis Medicare Ltd's latest results show a return to profitability with a net profit of ₹8.89 crores for Q4 FY26, but significant concerns arise from a 15.09% decline in net sales and compressed operating margins, indicating potential operational challenges. Investors should be cautious due to reliance on non-operating income for profitability.

Themis Medicare Ltd's latest results present a mixed picture. On one hand, the company has returned to profitability, reporting a consolidated net profit of ₹8.89 crores for Q4 FY26, compared to a loss in the same quarter last year. This represents a positive turnaround year-on-year.<BR><BR>However, when looking at the quarter-on-quarter performance, there are significant concerns. The net sales decreased by 15.09% from the previous quarter, and operating margins have sharply compressed from 10.86% to 4.91%. This decline in revenue and margin raises questions about the company's operational stability and sustainability.<BR><BR>Additionally, the profit after tax (PAT) margin did see a slight improvement, but it was largely supported by non-operating income, which accounted for a substantial portion of the profit before tax. This heavy reliance on non-operating income could be a red flag for investors regarding the sustainability of the reported profitability.<BR><BR>Overall, while the return to profit is a positive sign, the significant revenue decline and margin compression indicate that Themis Medicare is facing operational challenges that could impact its future performance. Investors should approach the company's prospects with caution until there is clearer evidence of consistent operational improvement.

View full answer

When is the next results date for Themis Medicare Ltd?

27-May-2026

The next results date for Themis Medicare Ltd is 28 May 2026.

The next results date for Themis Medicare Ltd is scheduled for 28 May 2026.

View full answer

Is Themis Medicare technically bullish or bearish?

26-Nov-2025

As of November 25, 2025, the technical trend has shifted to a bearish stance, supported by daily moving averages and weekly Bollinger Bands, despite some short-term bullish signals from the KST.

As of 25 November 2025, the technical trend has changed from mildly bearish to bearish. The current technical stance is bearish with moderate strength. Key indicators driving this stance include the daily moving averages showing bearish momentum and the weekly Bollinger Bands confirming a bearish trend. The MACD on a monthly basis is also bearish, while the weekly KST is mildly bullish, indicating some divergence in shorter time frames. Overall, the bearish sentiment is reinforced by the significant negative returns over the past month and year, contrasting sharply with the broader market performance.

View full answer

How has been the historical performance of Themis Medicare?

13-Nov-2025

Themis Medicare has shown growth in net sales and total assets from March 2019 to March 2025, increasing from INR 183.75 crore to INR 405.51 crore in sales. However, profitability has declined, with profit after tax dropping from INR 61.54 crore in March 2022 to INR 23.90 crore in March 2025.

Answer:<BR>The historical performance of Themis Medicare shows a fluctuating trend in key financial metrics over the years, with notable changes in revenue, profit, and expenses.<BR><BR>Breakdown:<BR>Themis Medicare's net sales have generally increased from INR 183.75 crore in March 2019 to INR 405.51 crore in March 2025, despite a dip in March 2022. Total operating income followed a similar pattern, reaching INR 405.51 crore in March 2025. However, total expenditure has also risen, amounting to INR 356.46 crore in March 2025, which includes significant costs such as raw materials and employee expenses. Operating profit, excluding other income, has fluctuated, peaking at INR 95.63 crore in March 2022 before declining to INR 49.05 crore in March 2025. Profit before tax showed a decline from INR 83.92 crore in March 2022 to INR 33.74 crore in March 2025, while profit after tax also decreased from INR 61.54 crore to INR 23.90 crore in the same period. The company's total assets grew from INR 345.34 crore in March 2020 to INR 588.03 crore in March 2025, with total liabilities increasing from INR 345.34 crore to INR 588.03 crore as well. Cash flow from operating activities improved to INR 34 crore in March 2025, although the net cash outflow was recorded at INR 3 crore. Overall, Themis Medicare has experienced growth in sales and assets, but profitability has faced challenges in recent years.

View full answer

Is Themis Medicare overvalued or undervalued?

05-Aug-2025

As of August 4, 2025, Themis Medicare's valuation has shifted from attractive to risky due to significant overvaluation indicated by a negative PE ratio of -103.96 and poor stock performance, with a year-to-date return of -60.97%, contrasting unfavorably with peers like Sun Pharma and Cipla.

As of 4 August 2025, Themis Medicare's valuation grade has moved from attractive to risky, indicating a significant deterioration in its market position. The company is currently overvalued based on its financial ratios, which include a PE ratio of -103.96, an EV to EBITDA of 103.48, and a Price to Book Value of 2.34. These figures suggest that the company's earnings are not only negative but also that it is trading at a substantial premium relative to its book value.<BR><BR>In comparison to its peers, Themis Medicare's valuation stands out unfavorably; for instance, Sun Pharma has a PE ratio of 34.25 and an EV to EBITDA of 23.19, while Cipla shows a more attractive PE of 22.7 and an EV to EBITDA of 15.96. The stark contrast in these ratios highlights Themis Medicare's overvaluation in the current market. Additionally, the company's recent stock performance has been poor, with a year-to-date return of -60.97%, significantly underperforming the Sensex, which has gained 3.69% in the same period.

View full answer

Who are the top shareholders of the Themis Medicare?

17-Jul-2025

The top shareholders of Themis Medicare include Vividhmargi Investments Pvt Ltd at 15.78%, individual investors with a collective 24.14%, and Anuj Anantrai Sheth as the highest public shareholder at 4.58%. Additionally, 13 foreign institutional investors hold a small portion of 0.1%, while mutual funds have no significant holdings.

The top shareholders of Themis Medicare include a mix of promoters and individual investors. The majority of the shares are held by promoters, with Vividhmargi Investments Pvt Ltd being the largest shareholder at 15.78%. Individual investors collectively hold 24.14% of the shares, while the highest public shareholder is Anuj Anantrai Sheth, who owns 4.58%. Additionally, there are 13 foreign institutional investors (FIIs) holding a small portion of 0.1%, and mutual funds have not reported any significant holdings.

View full answer

Has Themis Medicare declared dividend?

06-Jun-2025

Themis Medicare Ltd has declared a 50% dividend, amounting to ₹0.5 per share, with an ex-date of July 12, 2024. While recent total returns show volatility with negative performance over the last 6 months and 1 year, longer-term returns have been more favorable.

Themis Medicare Ltd has declared a 50% dividend.<BR><BR>Dividend Details:<BR>- Percentage announced: 50%<BR>- Amount per share: 0.5<BR>- Ex-date: Jul-12-2024<BR><BR>Dividend Yield: 0.36%.<BR><BR>Total Returns by Period:<BR>In the last 6 months, the price return was -53.28%, with a dividend return of 0%, resulting in a total return of -53.28%.<BR><BR>Over the past year, the price return was -35.38%, the dividend return was 0.23%, leading to a total return of -35.15%.<BR><BR>In the 2-year period, the price return was -7.2%, the dividend return was 3.84%, culminating in a total return of -3.36%.<BR><BR>For the 3-year period, the price return was 73.83%, with a dividend return of 14.40%, resulting in a total return of 88.23%.<BR><BR>In the last 4 years, the price return was 76.12%, the dividend return was 20.90%, which gives a total return of 97.02%.<BR><BR>Over the past 5 years, the price return was 299.5%, with a dividend return of 47.83%, leading to an impressive total return of 347.33%.<BR><BR>Overall, Themis Medicare has declared a dividend, but the recent total returns indicate significant volatility, particularly in the short term, with negative returns over the last 6 months and 1 year, while longer-term returns show a more favorable performance.

View full answer
iScoreScore
Click here to find our call on this stock
Strong Sell
Sell
Hold
Buy
Strong Buy

Dashboard

1

Low ability to service debt as the company has a high Debt to EBITDA ratio of 100.09 times

  • Low ability to service debt as the company has a high Debt to EBITDA ratio of 100.09 times
2

Poor long term growth as Operating profit has grown by an annual rate -194.65% of over the last 5 years

3

Risky - Negative EBITDA

4

43.39% of Promoter Shares are Pledged

stock-summaryMojo Parameters

Mojo Parameters

Loading Valuation Snapshot...

Stock DNA

stock-summary
Industry

Pharmaceuticals & Biotechnology

stock-summary
Market cap

INR 1,142 Cr (Micro Cap)

stock-summary
P/E

NA (Loss Making)

stock-summary
Industry P/E

38

stock-summary
Dividend Yield

0.00%

stock-summary
Debt Equity

0.23

stock-summary
Return on Equity

0.50%

stock-summary
Price to Book

2.88

Revenue and Profits:
Net Sales:
87 Cr
(Quarterly Results - Jun 2026)
Net Profit:
25 Cr
stock-summaryTotal Returns
Total Returns (Price + Dividend) stock-summary
Dividend Yield (0%)
TimePeriod
Price Return
Dividend Return
Total Return
3 Months
5.29%
0.44%
5.73%
6 Months
63.42%
0.71%
64.13%
1 Year
-4.29%
0.38%
-3.91%
2 Years
-56.84%
0.36%
-56.48%
3 Years
-28.33%
0.81%
-27.52%
4 Years
12.76%
1.95%
14.71%
5 Years
19.62%
2.64%
22.26%

Latest dividend: 0.5 per share ex-dividend date: Sep-04-2025

Risk Adjusted Returns v/s stock-summary
Returns Beta
Icon
Beta has not been calculated since enough price history is not available
stock-summaryNews & Corporate Actions

News

Themis Medicare Gains 6.09%: Technical Upgrades Drive Weekly Outperformance

Announcements stock-summary

Corporate Action -Fixed Record Date For Dividend For FY 2025-26.

18-Sep-2026 | Source : BSE

Please refer to the attachment.

Announcement under Regulation 30 (LODR)-Newspaper Publication

09-Sep-2026 | Source : BSE

Please refer to Newspaper publication for Notice of 56th AGM scheduled on 30th September 2026.

Reg. 34 (1) Annual Report.

08-Sep-2026 | Source : BSE

Please refer to our Annual Report for F.Y. 2025-26

Corporate Actions stock-summary

stock-summary
BOARD MEETING

No Upcoming Board Meetings

stock-summary
DIVIDEND

Themis Medicare Ltd has declared 50% dividend, ex-date: 04 Sep 25

stock-summary
SPLITS

Themis Medicare Ltd has announced 1:10 stock split, ex-date: 10 Oct 23

stock-summary
BONUS

No Bonus history available

stock-summary
RIGHTS

No Rights history available

stock-summaryKey Factors

Quality key factors stock-summary

Factor
Value
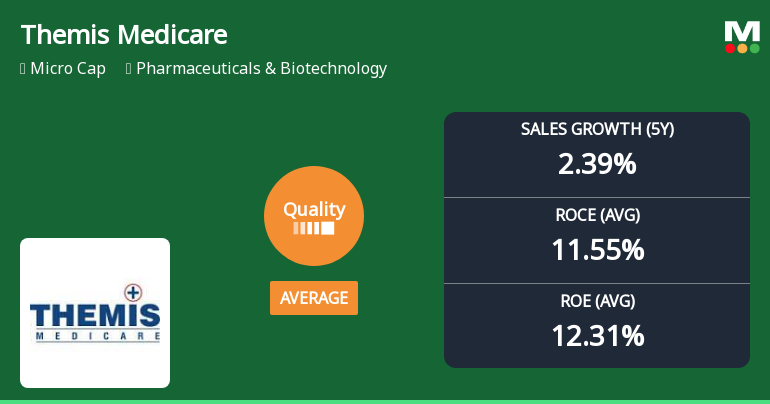
Sales Growth (5y)
2.39%
EBIT Growth (5y)
-194.65%
EBIT to Interest (avg)
2.84
Debt to EBITDA (avg)
10.13
Net Debt to Equity (avg)
0.23
Sales to Capital Employed (avg)
0.86
Tax Ratio
26.76%
Dividend Payout Ratio
402.57%
Pledged Shares
43.39%
Institutional Holding
0.02%
ROCE (avg)
11.55%
ROE (avg)
12.31%

Valuation key factors

Factor
Value
P/E Ratio
NA (Loss Making)
Industry P/E
38
Price to Book Value
2.86
EV to EBIT
-23.58
EV to EBITDA
-29.37
EV to Capital Employed
2.52
EV to Sales
3.72
PEG Ratio
NA
Dividend Yield
NA
ROCE (Latest)
-2.03%
ROE (Latest)
0.50%

Technicals key factors

Indicator
Weekly
Monthly
MACD
Bullish
Mildly Bullish
RSI
No Signal
No Signal
Bollinger Bands
Mildly Bullish
Mildly Bullish
Moving Averages
Bullish (Daily)
KST
Mildly Bearish
Mildly Bullish
Dow Theory
No Trend
Mildly Bullish
OBV
No Trend
Bullish
stock-summary Technical Indicator Scale: Bearish, Mildly Bearish, Sideways, Mildly Bullish, Bullish  Turned 
stock-summaryShareholding
Shareholding Snapshot : Jun 2026stock-summary
Shareholding Compare (%holding) stock-summary
Majority shareholders

Promoters

Pledged Promoter Holdings

43.3914

Mutual Funds

Held by 2 Schemes (0.0%)

FIIs

Held by 3 FIIs (0.01%)

Promoter with highest holding

Dinesh Shantilal Patel, Jayshree Dinesh Patel, Sachin Dinesh Patel (trustees Of Vividhmargi Trust) (27.49%)

Highest Public shareholder

Anuj Anantrai Sheth (3.8%)

Individual Investors Holdings

23.57%

stock-summaryFinancial
[
  {
    "link": "quarterly",
    "btn_text": "All Quarterly Results",
    "header": "Quarterly Results Snapshot (Consolidated) - Jun'26 - QoQ",
    "rhs": [
      {
        "prefix": "Net Sales ",
        "suffix": "QoQ Growth in quarter ended Jun 2026 is 13.63% vs -15.09% in Mar 2026",
        "dir": 1
      },
      {
        "prefix": "Consolidated Net Profit ",
        "suffix": "QoQ Growth in quarter ended Jun 2026 is 176.83% vs -11.89% in Mar 2026",
        "dir": 1
      }
    ],
    "table": {
      "header": [
        "Jun'26",
        "Mar'26",
        "Change(%)"
      ],
      "body": [
        {
          "field": "Net Sales",
          "val1": "86.96",
          "val2": "76.53",
          "chgp": "13.63%",
          "chgp_class": "positive"
        },
        {
          "field": "Operating Profit (PBDIT) excl Other Income",
          "val1": "-52.42",
          "val2": "3.76",
          "chgp": "-1,494.15%",
          "chgp_class": "negative"
        },
        {
          "field": "Interest",
          "val1": "2.98",
          "val2": "2.70",
          "chgp": "10.37%",
          "chgp_class": "negative"
        },
        {
          "field": "Exceptional Items",
          "val1": "92.95",
          "val2": "0.00",
          "chgp": "",
          "chgp_class": "neutral"
        },
        {
          "field": "Consolidate Net Profit",
          "val1": "24.61",
          "val2": "8.89",
          "chgp": "176.83%",
          "chgp_class": "positive"
        },
        {
          "field": "Operating Profit Margin (Excl OI)",
          "val1": "-60.28%",
          "val2": "4.91%",
          "chgp": "-65.19%",
          "chgp_class": "negative"
        }
      ]
    }
  },
  {
    "link": "half-yearly",
    "btn_text": "All Half Yearly Results",
    "header": "Half Yearly Results Snapshot (Consolidated) - Sep'25",
    "rhs": [
      {
        "prefix": "Net Sales ",
        "suffix": " Growth in half year ended Sep 2025 is -26.85% vs 19.15% in Sep 2024",
        "dir": -1
      },
      {
        "prefix": "Consolidated Net Profit ",
        "suffix": " Growth in half year ended Sep 2025 is -145.77% vs 32.09% in Sep 2024",
        "dir": -1
      }
    ],
    "table": {
      "header": [
        "Sep'25",
        "Sep'24",
        "Change(%)"
      ],
      "body": [
        {
          "field": "Net Sales",
          "val1": "175.57",
          "val2": "240.00",
          "chgp": "-26.85%",
          "chgp_class": "negative"
        },
        {
          "field": "Operating Profit (PBDIT) excl Other Income",
          "val1": "-13.17",
          "val2": "46.30",
          "chgp": "-128.44%",
          "chgp_class": "negative"
        },
        {
          "field": "Interest",
          "val1": "5.24",
          "val2": "4.80",
          "chgp": "9.17%",
          "chgp_class": "negative"
        },
        {
          "field": "Exceptional Items",
          "val1": "0.00",
          "val2": "0.00",
          "chgp": "",
          "chgp_class": "neutral"
        },
        {
          "field": "Consolidate Net Profit",
          "val1": "-17.84",
          "val2": "38.98",
          "chgp": "-145.77%",
          "chgp_class": "negative"
        },
        {
          "field": "Operating Profit Margin (Excl OI)",
          "val1": "-7.50%",
          "val2": "19.29%",
          "chgp": "-26.79%",
          "chgp_class": "negative"
        }
      ]
    }
  },
  {
    "link": "nine-monthly",
    "btn_text": "All Nine Monthly Results",
    "header": "Nine Monthly Results Snapshot (Consolidated) - Dec'25",
    "rhs": [
      {
        "prefix": "Net Sales ",
        "suffix": "YoY Growth in nine months ended Dec 2025 is -20.40% vs 17.56% in Dec 2024",
        "dir": -1
      },
      {
        "prefix": "Consolidated Net Profit ",
        "suffix": "YoY Growth in nine months ended Dec 2025 is -119.62% vs 7.10% in Dec 2024",
        "dir": -1
      }
    ],
    "table": {
      "header": [
        "Dec'25",
        "Dec'24",
        "Change(%)"
      ],
      "body": [
        {
          "field": "Net Sales",
          "val1": "265.70",
          "val2": "333.81",
          "chgp": "-20.40%",
          "chgp_class": "negative"
        },
        {
          "field": "Operating Profit (PBDIT) excl Other Income",
          "val1": "-3.38",
          "val2": "54.83",
          "chgp": "-106.16%",
          "chgp_class": "negative"
        },
        {
          "field": "Interest",
          "val1": "7.99",
          "val2": "7.59",
          "chgp": "5.27%",
          "chgp_class": "negative"
        },
        {
          "field": "Exceptional Items",
          "val1": "-0.87",
          "val2": "0.00",
          "chgp": "",
          "chgp_class": "neutral"
        },
        {
          "field": "Consolidate Net Profit",
          "val1": "-7.75",
          "val2": "39.50",
          "chgp": "-119.62%",
          "chgp_class": "negative"
        },
        {
          "field": "Operating Profit Margin (Excl OI)",
          "val1": "-1.27%",
          "val2": "16.43%",
          "chgp": "-17.70%",
          "chgp_class": "negative"
        }
      ]
    }
  },
  {
    "link": "annual",
    "btn_text": "All Annual Results",
    "header": "Annual Results Snapshot (Consolidated) - Mar'26",
    "rhs": [
      {
        "prefix": "Net Sales ",
        "suffix": "YoY Growth in year ended Mar 2026 is -15.60% vs 6.22% in Mar 2025",
        "dir": -1
      },
      {
        "prefix": "Consolidated Net Profit ",
        "suffix": "YoY Growth in year ended Mar 2026 is -96.18% vs -31.46% in Mar 2025",
        "dir": -1
      }
    ],
    "table": {
      "header": [
        "Mar'26",
        "Mar'25",
        "Change(%)"
      ],
      "body": [
        {
          "field": "Net Sales",
          "val1": "342.24",
          "val2": "405.51",
          "chgp": "-15.60%",
          "chgp_class": "negative"
        },
        {
          "field": "Operating Profit (PBDIT) excl Other Income",
          "val1": "0.40",
          "val2": "49.05",
          "chgp": "-99.18%",
          "chgp_class": "negative"
        },
        {
          "field": "Interest",
          "val1": "10.69",
          "val2": "10.04",
          "chgp": "6.47%",
          "chgp_class": "negative"
        },
        {
          "field": "Exceptional Items",
          "val1": "-0.87",
          "val2": "0.00",
          "chgp": "",
          "chgp_class": "neutral"
        },
        {
          "field": "Consolidate Net Profit",
          "val1": "1.14",
          "val2": "29.83",
          "chgp": "-96.18%",
          "chgp_class": "negative"
        },
        {
          "field": "Operating Profit Margin (Excl OI)",
          "val1": "0.12%",
          "val2": "12.10%",
          "chgp": "-11.98%",
          "chgp_class": "negative"
        }
      ]
    }
  }
]

Quarterly Results Snapshot (Consolidated) - Jun'26 - QoQstock-summary

Jun'26
Mar'26
Change(%)
Net Sales
86.96
76.53
13.63%
Operating Profit (PBDIT) excl Other Income
-52.42
3.76
-1,494.15%
Interest
2.98
2.70
10.37%
Exceptional Items
92.95
0.00
Consolidate Net Profit
24.61
8.89
176.83%
Operating Profit Margin (Excl OI)
-60.28%
4.91%
-65.19%
Values in Rs Cr.
Direction Arrows
Net Sales

QoQ Growth in quarter ended Jun 2026 is 13.63% vs -15.09% in Mar 2026

Direction Arrows
Consolidated Net Profit

QoQ Growth in quarter ended Jun 2026 is 176.83% vs -11.89% in Mar 2026

Half Yearly Results Snapshot (Consolidated) - Sep'25stock-summary

Sep'25
Sep'24
Change(%)
Net Sales
175.57
240.00
-26.85%
Operating Profit (PBDIT) excl Other Income
-13.17
46.30
-128.44%
Interest
5.24
4.80
9.17%
Exceptional Items
0.00
0.00
Consolidate Net Profit
-17.84
38.98
-145.77%
Operating Profit Margin (Excl OI)
-7.50%
19.29%
-26.79%
Values in Rs Cr.
Direction Arrows
Net Sales

Growth in half year ended Sep 2025 is -26.85% vs 19.15% in Sep 2024

Direction Arrows
Consolidated Net Profit

Growth in half year ended Sep 2025 is -145.77% vs 32.09% in Sep 2024

Nine Monthly Results Snapshot (Consolidated) - Dec'25stock-summary

Dec'25
Dec'24
Change(%)
Net Sales
265.70
333.81
-20.40%
Operating Profit (PBDIT) excl Other Income
-3.38
54.83
-106.16%
Interest
7.99
7.59
5.27%
Exceptional Items
-0.87
0.00
Consolidate Net Profit
-7.75
39.50
-119.62%
Operating Profit Margin (Excl OI)
-1.27%
16.43%
-17.70%
Values in Rs Cr.
Direction Arrows
Net Sales

YoY Growth in nine months ended Dec 2025 is -20.40% vs 17.56% in Dec 2024

Direction Arrows
Consolidated Net Profit

YoY Growth in nine months ended Dec 2025 is -119.62% vs 7.10% in Dec 2024

Annual Results Snapshot (Consolidated) - Mar'26stock-summary

Mar'26
Mar'25
Change(%)
Net Sales
342.24
405.51
-15.60%
Operating Profit (PBDIT) excl Other Income
0.40
49.05
-99.18%
Interest
10.69
10.04
6.47%
Exceptional Items
-0.87
0.00
Consolidate Net Profit
1.14
29.83
-96.18%
Operating Profit Margin (Excl OI)
0.12%
12.10%
-11.98%
Values in Rs Cr.
Direction Arrows
Net Sales

YoY Growth in year ended Mar 2026 is -15.60% vs 6.22% in Mar 2025

Direction Arrows
Consolidated Net Profit

YoY Growth in year ended Mar 2026 is -96.18% vs -31.46% in Mar 2025

stock-summaryCompany CV
About Themis Medicare Ltd stock-summary
stock-summary
Themis Medicare Ltd
Micro Cap
Pharmaceuticals & Biotechnology
Themis Medicare Limited was formerly incorporated as 'Themis Chemicals Limited' in 1969. The Company was originally promoted by Chemosyn and Medimpex but was taken over by a Group consisting of Shantibhai D Patel and K T Lakdawala who also have interests in Andhra Synthetics and Antibiotics, which was merged with Artemis Pharmaceuticals in April, 1993. Thereafter, the name of the Company was changed to Themis Medicare Limited in 2001.
Company Coordinates stock-summary
Company Details
Plot No 69 A GIDC Indl Estate, Vapi Valsad Gujarat : 396195
stock-summary
Tel: 91-260-2421675
stock-summary
themis@themismedicare.com
Registrar Details
Link Intime India Pvt Ltd, C-13 Pannalal Silk Compound, L B S Marg, Bhandup , Mumbai