
Compare Firstsour.Solu. with Similar Stocks
Dashboard
Company has a Debt to Equity ratio (avg) of 0.48 times
The company has declared Positive results for the last 5 consecutive quarters
With ROCE of 16.1, it has a Very Attractive valuation with a 2.8 Enterprise value to Capital Employed
High Institutional Holdings at 34.35%
Underperformed the market in the last 1 year
With its market cap of Rs 17,198 cr, it is the biggest company in the sector and constitutes 42.17% of the entire sector
Stock DNA
Commercial Services & Supplies
INR 17,220 Cr (Small Cap)
23.00
22
2.26%
0.59
17.16%
3.92
Total Returns (Price + Dividend) 
Latest dividend: 5.5 per share ex-dividend date: Feb-20-2026
Risk Adjusted Returns v/s
Returns Beta

News

Firstsource Solutions Ltd is Rated Hold
Firstsource Solutions Ltd is rated 'Hold' by MarketsMOJO, with this rating last updated on 29 December 2025. However, the analysis and financial metrics discussed below reflect the company’s current position as of 24 June 2026, providing investors with an up-to-date view of the stock’s fundamentals, valuation, financial trends, and technical outlook.
Read full news article
Firstsource Solutions Ltd is Rated Hold
Firstsource Solutions Ltd is rated 'Hold' by MarketsMOJO, with this rating last updated on 29 December 2025. However, the analysis and financial metrics discussed here reflect the stock's current position as of 13 June 2026, providing investors with an up-to-date perspective on the company’s fundamentals, valuation, financial trends, and technical outlook.
Read full news article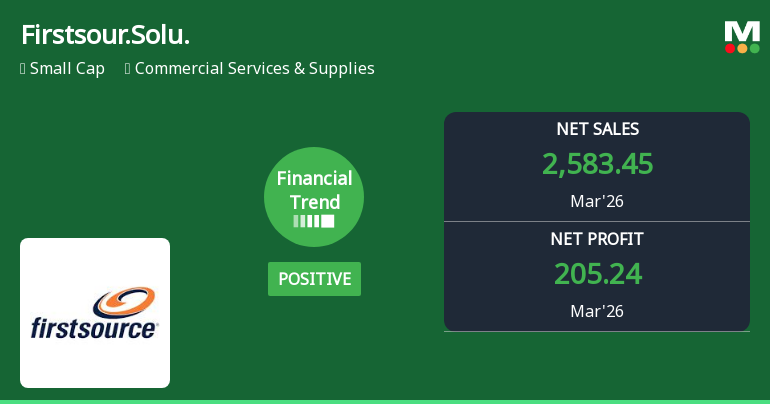
Firstsource Solutions Ltd Reports Record Quarterly Performance Amid Flattening Financial Trend
Firstsource Solutions Ltd reported its highest quarterly revenue and profit figures in March 2026, yet its financial trend has shifted from positive to flat, reflecting emerging challenges in margin sustainability and operational efficiency despite robust top-line growth.
Read full news article Announcements
Announcement under Regulation 30 (LODR)-Analyst / Investor Meet - Intimation
18-Jun-2026 | Source : BSEThe Intimation of Investor/Analyst sessions scheduled to be held on Wednesday June 24 2026 is as enclosed.
Announcement under Regulation 30 (LODR)-Allotment of ESOP / ESPS
17-Jun-2026 | Source : BSEAllotment of ESOP dated June 17 2026 is as enclosed
Announcement under Regulation 30 (LODR)-Newspaper Publication
17-Jun-2026 | Source : BSENotice given to shareholders regarding transfer of equity shares to the Investor Education and Protection Fund (IEPF) is as enclosed
Corporate Actions

No Upcoming Board Meetings

Firstsource Solutions Ltd has declared 55% dividend, ex-date: 20 Feb 26

No Splits history available

No Bonus history available

No Rights history available
Quality key factors
Valuation key factors
Technicals key factors
 Technical Indicator Scale: Bearish, Mildly Bearish, Sideways, Mildly Bullish, Bullish Turned
 Shareholding Snapshot : Mar 2026
Shareholding Compare (%holding)
Promoters
None
Held by 28 Schemes (18.49%)
Held by 148 FIIs (8.86%)
Rpsg Ventures Limited (53.66%)
Hdfc Small Cap Fund (8.46%)
9.42%
Quarterly Results Snapshot (Consolidated) - Mar'26 - QoQ

QoQ Growth in quarter ended Mar 2026 is 5.75% vs 5.66% in Dec 2025
QoQ Growth in quarter ended Mar 2026 is 70.56% vs -32.97% in Dec 2025
Half Yearly Results Snapshot (Consolidated) - Sep'25
Growth in half year ended Sep 2025 is 21.89% vs 21.09% in Sep 2024
Growth in half year ended Sep 2025 is 27.56% vs 8.30% in Sep 2024
Nine Monthly Results Snapshot (Consolidated) - Dec'25

YoY Growth in nine months ended Dec 2025 is 19.83% vs 24.71% in Dec 2024
YoY Growth in nine months ended Dec 2025 is 8.16% vs 13.78% in Dec 2024
Annual Results Snapshot (Consolidated) - Mar'26
YoY Growth in year ended Mar 2026 is 19.75% vs 25.95% in Mar 2025
YoY Growth in year ended Mar 2026 is 13.45% vs 15.49% in Mar 2025
About Firstsource Solutions Ltd

Company Coordinates


