
Compare Foseco Crucible with Similar Stocks
Dashboard
Flat results in Mar 26
- NET SALES(Q) At Rs 37.35 cr has Fallen at -15.5% (vs previous 4Q average)
- PBT LESS OI(Q) At Rs 6.81 cr has Fallen at -12.5% (vs previous 4Q average)
- NON-OPERATING INCOME(Q) is 46.12 % of Profit Before Tax (PBT)
With ROE of 26.8, it has a Very Expensive valuation with a 5.7 Price to Book Value
Stock DNA
Electrodes & Refractories
INR 770 Cr (Micro Cap)
21.00
38
1.37%
-0.11
26.84%
5.74
Total Returns (Price + Dividend) 
Latest dividend: 18.991980519480517 per share ex-dividend date: Aug-14-2025
Risk Adjusted Returns v/s
Returns Beta

News
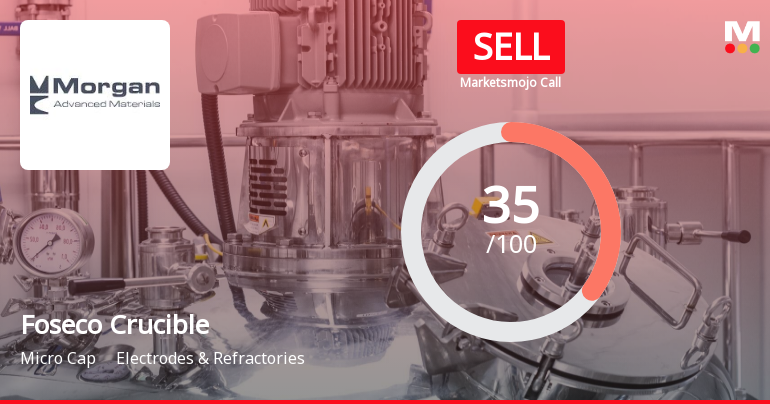
Foseco Crucible (India) Ltd is Rated Sell
Foseco Crucible (India) Ltd is rated 'Sell' by MarketsMOJO, with this rating last updated on 05 Jan 2026. However, all fundamentals, returns, and financial metrics discussed here reflect the stock's current position as of 26 June 2026, providing investors with an up-to-date analysis of the company’s standing.
Read full news article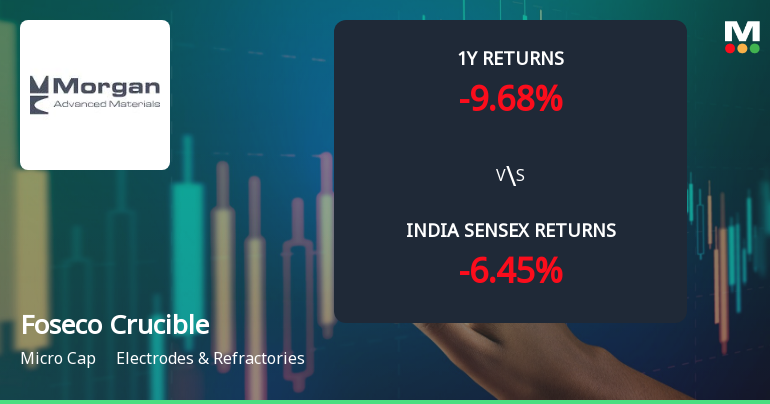
Foseco Crucible (India) Ltd Sees Technical Momentum Shift Amid Mixed Indicator Signals
Foseco Crucible (India) Ltd, a micro-cap player in the Electrodes & Refractories sector, has experienced a notable shift in its technical momentum, reflected in a 10.00% surge in its share price to ₹1,319.70 on 23 Jun 2026. Despite this intraday strength, the stock’s broader technical indicators present a complex picture, with mixed signals from MACD, RSI, moving averages, and other momentum oscillators, prompting a recent downgrade in its Mojo Grade from Hold to Sell.
Read full news article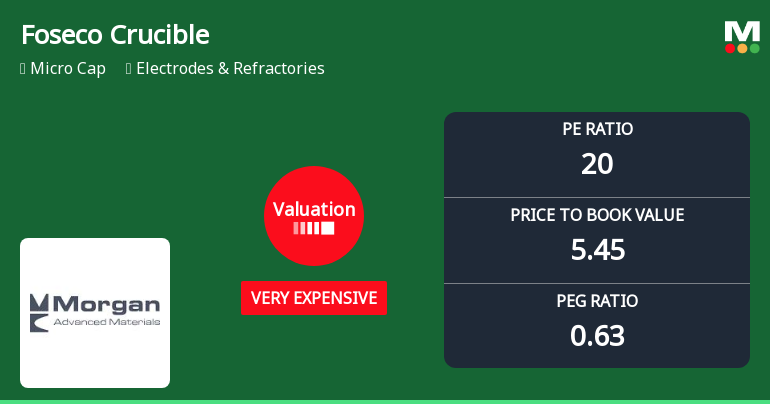
Foseco Crucible (India) Ltd Valuation Shifts Signal Heightened Price Risk
Foseco Crucible (India) Ltd has seen a marked shift in its valuation parameters, moving from an expensive to a very expensive rating as of early January 2026. Despite a robust 10% surge in share price on 23 June 2026, the micro-cap company’s price-to-earnings (P/E) and price-to-book value (P/BV) multiples now stand well above industry peers, raising questions about price attractiveness amid mixed returns versus the broader market.
Read full news article Announcements
Intimation Of Completion Of The Sale Of Certain Equity Shares Of Face Value Of INR 5 Each (Equity Shares) Of Foseco Crucible (India) Limited (Formerly Known As Morganite Crucible (India) Limited) (Company) By Its Promoter Foseco India Limited In The Op
22-Jun-2026 | Source : BSEDocument attached
Compliances-Reg.24(A)-Annual Secretarial Compliance
29-May-2026 | Source : BSEAnnual Secretarial Compliance report attached
Intimation Of Proposed Sale Of Certain Equity Shares Of The Company By The Holding Company Foseco India Limited In The Open Market To Achieve Minimum Public Shareholding
15-May-2026 | Source : BSEEnclosed
Corporate Actions

No Upcoming Board Meetings

Foseco Crucible (India) Ltd has declared 380% dividend, ex-date: 14 Aug 25

Foseco Crucible (India) Ltd has announced 5:10 stock split, ex-date: 31 Aug 20

No Bonus history available

No Rights history available
Quality key factors
Valuation key factors
Technicals key factors
 Technical Indicator Scale: Bearish, Mildly Bearish, Sideways, Mildly Bullish, Bullish Turned
 Shareholding Snapshot : Mar 2026
Shareholding Compare (%holding)
Promoters
None
Held by 0 Schemes
Held by 1 FIIs (0.16%)
Foseco India Limited (76.77%)
None
19.37%
Quarterly Results Snapshot (Standalone) - Mar'26 - QoQ

QoQ Growth in quarter ended Mar 2026 is -18.96% vs 0.35% in Dec 2025
QoQ Growth in quarter ended Mar 2026 is -125.13% vs -36.56% in Dec 2025
Half Yearly Results Snapshot (Standalone) - Sep'25

Growth in half year ended Sep 2025 is 1.46% vs -0.95% in Sep 2024
Growth in half year ended Sep 2025 is -13.44% vs 4.28% in Sep 2024
Nine Monthly Results Snapshot (Standalone) - Dec'25
YoY Growth in nine months ended Dec 2025 is 2.05% vs 2.98% in Dec 2024
YoY Growth in nine months ended Dec 2025 is -18.41% vs 8.21% in Dec 2024
Annual Results Snapshot (Standalone) - Mar'26
YoY Growth in year ended Mar 2026 is -1.30% vs 3.73% in Mar 2025
YoY Growth in year ended Mar 2026 is -32.03% vs 17.24% in Mar 2025
About Foseco Crucible (India) Ltd

Company Coordinates


