
 Price Point
Compare Sarda Proteins with Similar Stocks
ScoreDashboard
With a Operating Losses, the company has a Weak Long Term Fundamental Strength
- Company's ability to service its debt is weak with a poor EBIT to Interest (avg) ratio of -0.58
- The company has been able to generate a Return on Equity (avg) of 8.81% signifying low profitability per unit of shareholders funds
Flat results in Jun 26
Risky - Negative EBITDA


 Total Returns
Total Returns (Price + Dividend) 
Sarda Proteins for the last several years.
Risk Adjusted Returns v/s
Returns Beta
 News & Corporate Actions
News
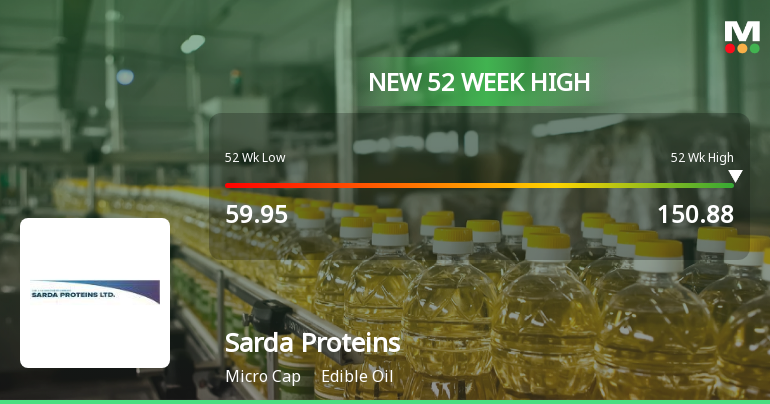
Broad-Based Technical Strength Lifts Sarda Proteins Ltd to 52-Week High of Rs 150.88
Surging past its previous peaks, Sarda Proteins Ltd touched a fresh 52-week high of Rs 150.88 on 22 Sep 2026, marking a remarkable rally of over 150% from its 52-week low of Rs 59.95. This milestone caps a sustained momentum phase, fuelled by a confluence of bullish technical indicators and consistent price strength over the past ten trading sessions.
Read full news article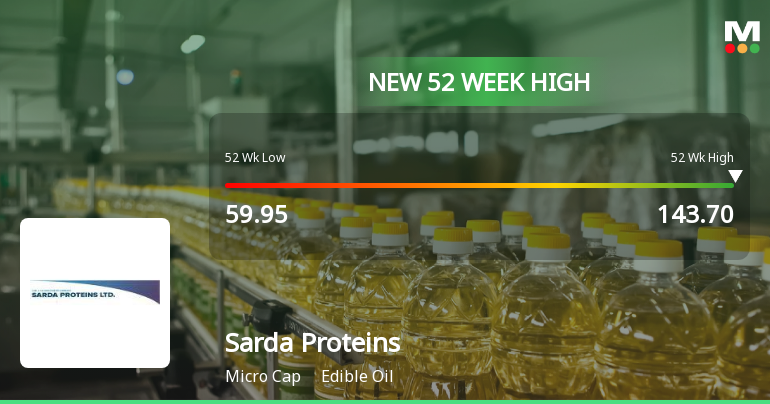
Broad-Based Technical Strength Lifts Sarda Proteins Ltd to 52-Week High of Rs 143.7
After a sustained rally spanning nine consecutive sessions and a 55.08% gain, Sarda Proteins Ltd surged to a fresh 52-week high of Rs 143.7 on 21 Sep 2026, outpacing its edible oil sector peers and demonstrating robust price momentum.
Read full news article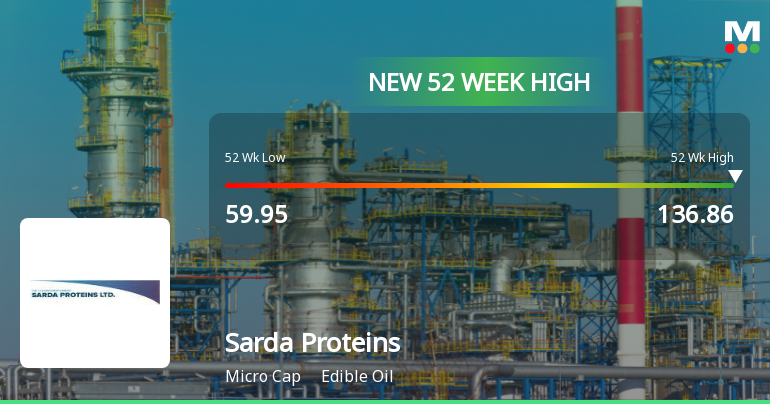
Broad-Based Technical Strength Lifts Sarda Proteins Ltd to 52-Week High of Rs 136.86
After a sustained rally over the past eight trading sessions, Sarda Proteins Ltd surged to a fresh 52-week high of Rs 136.86 on 18 Jun 2026, marking a remarkable 47.7% gain during this period. This milestone reflects a strong alignment of technical indicators and robust price momentum that has propelled the stock well above its key moving averages.
Read full news article Announcements
Clarificaion Of Price Movement
17-Sep-2026 | Source : BSEClarification of Price Movement
Announcement under Regulation 30 (LODR)-Change of Company Name
16-Sep-2026 | Source : BSEattached herewith BSE FINAL NAME CHANGE APPROVAL LETTER for our company with new SCRIP ID to be effective from 21.09.2026.
CLARIFICATION FOR PRICE MOVEMENT
16-Sep-2026 | Source : BSEAS ATTACHED
Corporate Actions

No Upcoming Board Meetings

No Dividend history available

No Splits history available

No Bonus history available

No Rights history available
Key FactorsQuality key factors
Valuation key factors
Technicals key factors
 Technical Indicator Scale: Bearish, Mildly Bearish, Sideways, Mildly Bullish, Bullish Turned Shareholding
Shareholding Snapshot : Jun 2026
Shareholding Compare (%holding)
Promoters
None
Held by 0 Schemes
Held by 0 FIIs
Onix Renewable Limited (78.24%)
None
17.92%
FinancialQuarterly Results Snapshot (Standalone) - Jun'26 - QoQ
 Compare with Peers
QoQ Growth in quarter ended Jun 2026 is 1,898.46% vs 160.00% in Mar 2026

QoQ Growth in quarter ended Jun 2026 is 97.62% vs 800.00% in Mar 2026

Half Yearly Results Snapshot (Standalone) - Sep'25
Growth in half year ended Sep 2025 is 10,800.00% vs -41.67% in Sep 2024
Growth in half year ended Sep 2025 is -400.00% vs 400.00% in Sep 2024
Nine Monthly Results Snapshot (Standalone) - Dec'25
YoY Growth in nine months ended Dec 2025 is -35.88% vs 1,850.81% in Dec 2024
YoY Growth in nine months ended Dec 2025 is -261.54% vs 0.00% in Dec 2024
Annual Results Snapshot (Standalone) - Mar'26
YoY Growth in year ended Mar 2026 is -33.20% vs 1,760.77% in Mar 2025
YoY Growth in year ended Mar 2026 is 6,300.00% vs -50.00% in Mar 2025
 Company CV
About Sarda Proteins Ltd

Company Coordinates










