
Compare Fujiyama Power with Similar Stocks
Dashboard
High Management Efficiency with a high ROCE of 0%
Strong ability to service debt as the company has a low Debt to EBITDA ratio of 1.06 times
Healthy long term growth as Net Sales has grown by an annual rate of 0% and Operating profit at 0%
With a growth in Operating Profit of 57.99%, the company declared Outstanding results in Mar 26
Majority shareholders : Promoters
Company is among the highest 1% of companies rated by MarketsMojo across all 4,000 stocks
Stock DNA
Other Electrical Equipment
INR 9,649 Cr (Small Cap)
32.00
60
0.00%
0.28
23.88%
7.42
Total Returns (Price + Dividend) 
Fujiyama Power for the last several years.
Risk Adjusted Returns v/s
Returns Beta

News

Fujiyama Power Systems Ltd Downgraded from Strong Buy to Buy Amid Quality and Valuation Concerns
Fujiyama Power Systems Ltd, a notable player in the Other Electrical Equipment sector, has seen its investment rating downgraded from Strong Buy to Buy as of 19 June 2026. This adjustment reflects a reassessment across four critical parameters: quality, valuation, financial trend, and technical outlook. Despite robust recent financial performance, the company’s quality grade has softened, and valuation metrics suggest a more cautious stance for investors.
Read full news article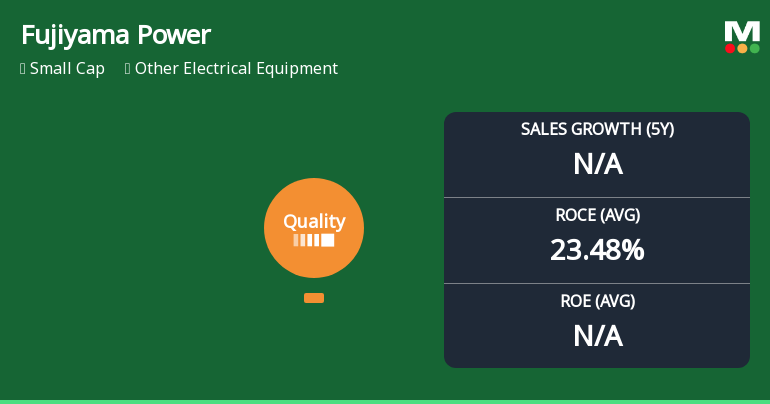
Fujiyama Power Systems Ltd Quality Grade Downgrade: A Detailed Analysis of Business Fundamentals
Fujiyama Power Systems Ltd, a small-cap player in the Other Electrical Equipment sector, has recently seen its quality grade downgraded from excellent to good, prompting a thorough examination of its business fundamentals. Despite a strong market performance year-to-date, the company’s key financial metrics reveal a nuanced picture of operational efficiency, leverage, and profitability that investors should carefully consider.
Read full news article
Fujiyama Power Systems Ltd is Rated Strong Buy
Fujiyama Power Systems Ltd is rated Strong Buy by MarketsMOJO, with this rating last updated on 26 May 2026. However, the analysis and financial metrics presented here reflect the company’s current position as of 19 June 2026, providing investors with the most up-to-date insight into the stock’s fundamentals, valuation, financial trends, and technical outlook.
Read full news article Announcements
Corporate Actions

No Upcoming Board Meetings

No Dividend history available

No Splits history available

No Bonus history available

No Rights history available
Quality key factors
Valuation key factors
Technicals key factors
 Technical Indicator Scale: Bearish, Mildly Bearish, Sideways, Mildly Bullish, Bullish Turned
 Shareholding Snapshot : Mar 2026
Shareholding Compare (%holding)
Promoters
None
Held by 7 Schemes (2.93%)
Held by 14 FIIs (1.93%)
Yogesh Dua (33.73%)
Nippon Life India Trustee Ltd-a/c Nippon India Small Cap Fund (2.2%)
4.7%
Quarterly Results Snapshot (Standalone) - Mar'26 - QoQ

QoQ Growth in quarter ended Mar 2026 is 53.07% vs 3.62% in Dec 2025
QoQ Growth in quarter ended Mar 2026 is 57.96% vs 7.01% in Dec 2025
Half Yearly Results Snapshot (Standalone) - Sep'25
Not Applicable: The company has declared_date for only one period
Not Applicable: The company has declared_date for only one period
Nine Monthly Results Snapshot (Standalone) - Dec'25
Not Applicable: The company has declared_date for only one period
Not Applicable: The company has declared_date for only one period
Annual Results Snapshot (Standalone) - Mar'26
YoY Growth in year ended Mar 2026 is 72.29% vs 66.62% in Mar 2025

YoY Growth in year ended Mar 2026 is 94.53% vs 245.12% in Mar 2025
About Fujiyama Power Systems Ltd

Company Coordinates


