
Compare Fujiyama Power with Similar Stocks
Dashboard
Strong Long Term Fundamental Strength with an average Return on Capital Employed (ROCE) of 0%
- Healthy long term growth as Net Sales has grown by an annual rate of 0% and Operating profit at 0%
- Strong ability to service debt as the company has a low Debt to EBITDA ratio of 1.06 times
With a growth in Operating Profit of 57.99%, the company declared Outstanding results in Mar 26
Majority shareholders : Promoters
Company is among the highest 1% of companies rated by MarketsMojo across all 4,000 stocks
Stock DNA
Other Electrical Equipment
INR 9,483 Cr (Small Cap)
31.00
56
0.00%
0.28
23.88%
7.67
Total Returns (Price + Dividend) 
Fujiyama Power for the last several years.
Risk Adjusted Returns v/s
Returns Beta

News
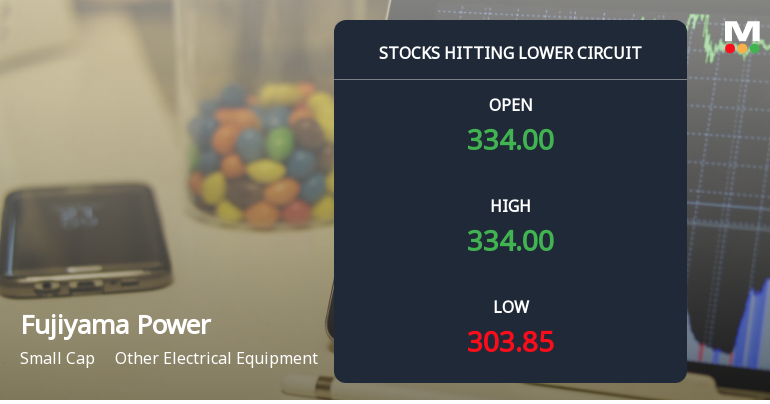
Fujiyama Power Systems Ltd Locks at Lower Circuit With 2.0% Loss — Sellers Queue, No Buyers in Sight
At Rs 314.0, sellers were still queuing — but there were no buyers willing to take the other side. Fujiyama Power Systems Ltd locked at its lower circuit of 2.0% on 11 Jun 2026, with unfilled sell orders and a frozen price.
Read full news article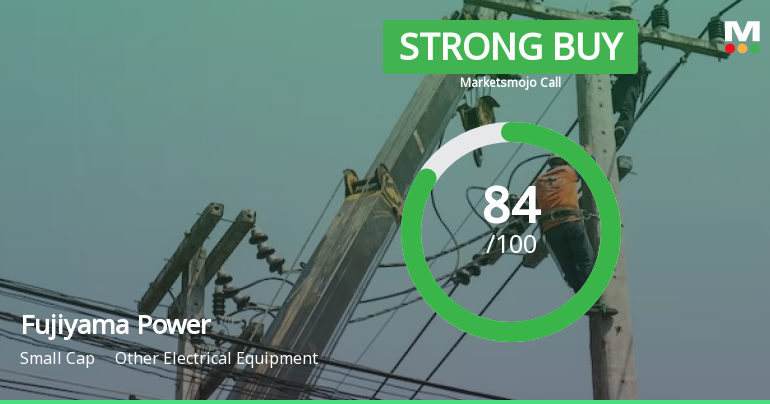
Fujiyama Power Systems Ltd is Rated Strong Buy
Fujiyama Power Systems Ltd is rated Strong Buy by MarketsMOJO, with this rating last updated on 26 May 2026. However, the analysis and financial metrics presented here reflect the company’s current position as of 08 June 2026, providing investors with the most up-to-date insight into the stock’s performance and outlook.
Read full news article
Fujiyama Power Systems Ltd is Rated Strong Buy
Fujiyama Power Systems Ltd is rated Strong Buy by MarketsMOJO, with this rating last updated on 26 May 2026. However, the analysis and financial metrics discussed below reflect the company’s current position as of 08 June 2026, providing investors with the latest insights into its performance and outlook.
Read full news article Announcements
Compliances-Reg.24(A)-Annual Secretarial Compliance
30-May-2026 | Source : BSEAnnual Secretarial Compliance Report for the year ended 31st March 2026.
Announcement under Regulation 30 (LODR)-Press Release / Media Release
22-May-2026 | Source : BSEFujiyama Power Systems Limited has informed the Exchange regarding a Press Release dated May 22 2026 titled 1.2 GW TopCon Solar Cell manufacturing Facility at Ratlam Madhya Pradesh.
Announcement under Regulation 30 (LODR)-Earnings Call Transcript
22-May-2026 | Source : BSEFujiyama Power Systems Limited has informed the exchange about transcripts of the Investor Conference Call on audited financial results and limited reviewed quarterly financials results ended March 31 2026.
Corporate Actions

No Upcoming Board Meetings

No Dividend history available

No Splits history available

No Bonus history available

No Rights history available
Quality key factors
Valuation key factors
Technicals key factors
 Technical Indicator Scale: Bearish, Mildly Bearish, Sideways, Mildly Bullish, Bullish Turned
 Shareholding Snapshot : Mar 2026
Shareholding Compare (%holding)
Promoters
None
Held by 7 Schemes (2.93%)
Held by 14 FIIs (1.93%)
Yogesh Dua (33.73%)
Nippon Life India Trustee Ltd-a/c Nippon India Small Cap Fund (2.2%)
4.7%
Quarterly Results Snapshot (Standalone) - Mar'26 - QoQ

QoQ Growth in quarter ended Mar 2026 is 53.07% vs 3.62% in Dec 2025
QoQ Growth in quarter ended Mar 2026 is 57.96% vs 7.01% in Dec 2025
Half Yearly Results Snapshot (Standalone) - Sep'25
Not Applicable: The company has declared_date for only one period
Not Applicable: The company has declared_date for only one period
Nine Monthly Results Snapshot (Standalone) - Dec'25
Not Applicable: The company has declared_date for only one period
Not Applicable: The company has declared_date for only one period
Annual Results Snapshot (Standalone) - Mar'26
YoY Growth in year ended Mar 2026 is 72.29% vs 66.62% in Mar 2025

YoY Growth in year ended Mar 2026 is 94.53% vs 245.12% in Mar 2025
About Fujiyama Power Systems Ltd

Company Coordinates


