
Compare G S Auto Intl. with Similar Stocks
Dashboard
Weak Long Term Fundamental Strength with an average Return on Capital Employed (ROCE) of 8.57%
- Poor long term growth as Net Sales has grown by an annual rate of 14.25% over the last 5 years
- Low ability to service debt as the company has a high Debt to EBITDA ratio of 2.18 times
99.87% of Promoter Shares are Pledged
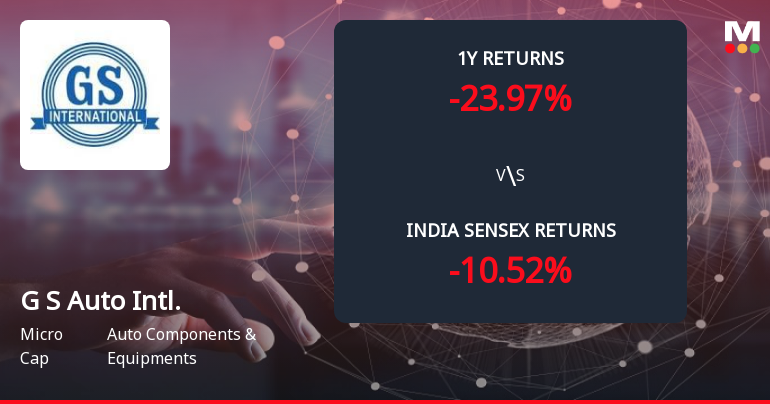
Underperformed the market in the last 1 year
Stock DNA
Auto Components & Equipments
INR 63 Cr (Micro Cap)
20.00
35
0.00%
0.88
12.63%
2.22
Total Returns (Price + Dividend) 
Latest dividend: 0.55 per share ex-dividend date: Sep-22-2011
Risk Adjusted Returns v/s
Returns Beta

News
G S Auto International Ltd Forms Death Cross Signalling Bearish Trend
G S Auto International Ltd, a micro-cap player in the Auto Components & Equipments sector, has recently formed a Death Cross, a significant technical indicator where the 50-day moving average (DMA) crosses below the 200-DMA. This development signals a potential shift towards a bearish trend, reflecting deteriorating momentum and raising concerns about the stock’s medium to long-term outlook.
Read full news article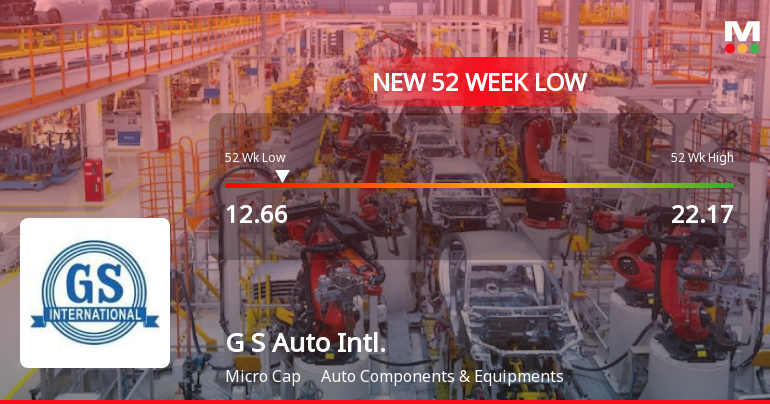
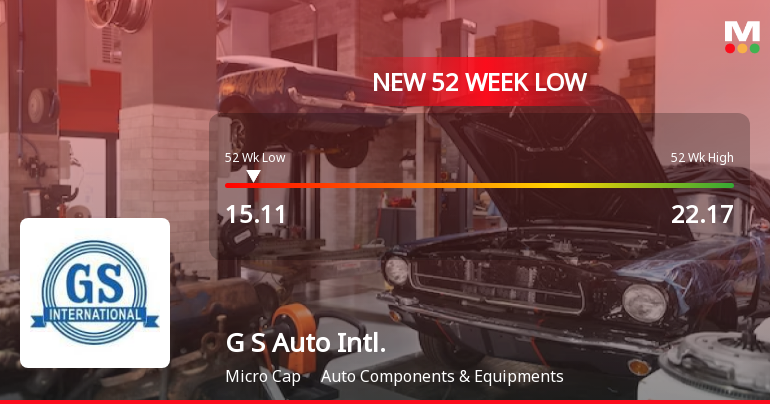
Five Consecutive Losses Push G S Auto International Ltd to a New 52-Week Low
For the fifth consecutive session, G S Auto International Ltd closed lower, slipping to a fresh 52-week low of Rs 15.11 on 2 Jun 2026. This marks a 13.82% decline over the past five days, underscoring persistent selling pressure despite a broadly recovering market backdrop.
Read full news article Announcements
Intimation For Closure Of Rights Issue Subscription Period Of G S Auto International Limited (Company).
10-Jun-2026 | Source : BSEClosure of Rights Issue Subscription Period of G S Auto International Limited (Company). Ref: Rights Issue of up to 29029160 (Two Crore Ninety Lakhs Twenty-Nine Thousand One Hundred Sixty) Partly paid-up Equity Shares of face value of Rs. 5.00/- each (Rupees Five Only) (Rights Equity Shares) of the Company for cash at a price of Rs. 10.00/- each (Rupees Ten Only) (Issue Price) for an aggregate amount of up to Rs. 2902.92/- Lakhs on a rights basis to the existing equity shareholders of our Company in the ratio of 2 (Two) Rights Equity Shares for every 01 (One) fully paid-up Equity Shares held by the existing Equity Shareholders on the record date i.e. Friday May 22 2026 under the SEBI (Issue of Capital and Disclosure Requirements) Regulations 2018.
Announcement under Regulation 30 (LODR)-Newspaper Publication
02-Jun-2026 | Source : BSENewspaper Publications of Extracts of Audited Financial Results for the Quarter and Financial Year ended 31st March 2026 along with QR Code in the Business Standard and Desh Sewak dated 02nd June 2026.
Board Meeting Outcome for Board Meeting Outcome For Approval Of Audited Financial Results For The Quarter And Financial Year Ended 31.03.2026 Along With Auditors Report Thereon
30-May-2026 | Source : BSEThe Board of Directors in its Meeting held on 30.05.2026 (Saturday) has approved the Audited Financial Results for the Quarter and Financial Year ended 31.03.2026 along with Auditors Report thereon & appointed Cost Auditors & Internal Auditor of the Company for the Financial Year 2026-27. The Meeting Commenced at 03:30 P.M. & concluded at 03:55 P.M.
Corporate Actions

No Upcoming Board Meetings

G S Auto International Ltd has declared 11% dividend, ex-date: 22 Sep 11

G S Auto International Ltd has announced 5:10 stock split, ex-date: 20 Aug 08

No Bonus history available

G S Auto International Ltd has announced 2:1 rights issue, ex-date: 22 May 26
Quality key factors
Valuation key factors
Technicals key factors
 Technical Indicator Scale: Bearish, Mildly Bearish, Sideways, Mildly Bullish, Bullish Turned
 Shareholding Snapshot : Mar 2026
Shareholding Compare (%holding)
Non Institution
99.8664
Held by 0 Schemes
Held by 0 FIIs
G J Holdings Private Limited (30.1%)
Renu Devi Patni (3.53%)
47.1%
Quarterly Results Snapshot (Standalone) - Mar'26 - QoQ

QoQ Growth in quarter ended Mar 2026 is 5.67% vs 27.29% in Dec 2025

QoQ Growth in quarter ended Mar 2026 is 87.84% vs 10.45% in Dec 2025
Half Yearly Results Snapshot (Standalone) - Sep'25
Growth in half year ended Sep 2025 is -3.69% vs -1.57% in Sep 2024
Growth in half year ended Sep 2025 is 50.59% vs 165.62% in Sep 2024
Nine Monthly Results Snapshot (Standalone) - Dec'25
YoY Growth in nine months ended Dec 2025 is 1.53% vs -4.25% in Dec 2024
YoY Growth in nine months ended Dec 2025 is 50.75% vs 235.00% in Dec 2024
Annual Results Snapshot (Standalone) - Mar'26
YoY Growth in year ended Mar 2026 is 3.63% vs -3.68% in Mar 2025
YoY Growth in year ended Mar 2026 is 139.44% vs 105.80% in Mar 2025
About G S Auto International Ltd

Company Coordinates


