
Compare Gabriel India with Similar Stocks
Dashboard
Low Debt Company with Strong Long Term Fundamental Strength
- Healthy long term growth as Operating profit has grown by an annual rate 36.69%
- The company is Net-Debt Free
- The company has been able to generate a Return on Capital Employed (avg) of 27.07% signifying high profitability per unit of total capital (equity and debt)
Flat results in Mar 26
With ROE of 19.2, it has a Expensive valuation with a 10.7 Price to Book Value
High Institutional Holdings at 22.86%
Consistent Returns over the last 3 years
Stock DNA
Auto Components & Equipments
INR 14,423 Cr (Small Cap)
56.00
35
0.48%
-0.12
19.19%
10.65
Total Returns (Price + Dividend) 
Latest dividend: 1.9 per share ex-dividend date: Nov-21-2025
Risk Adjusted Returns v/s
Returns Beta

News
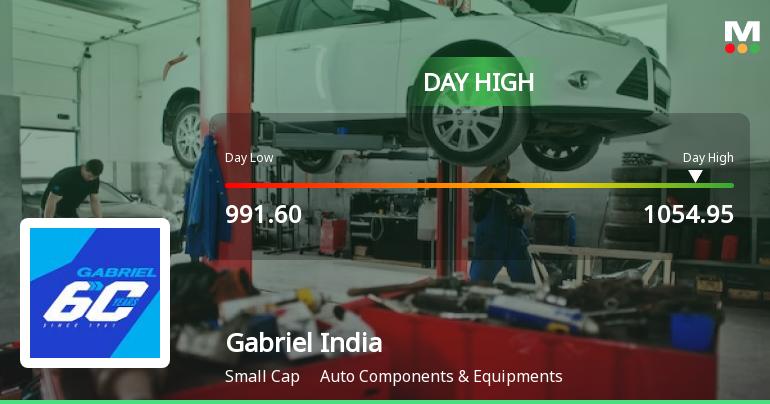
Gabriel India Ltd Surges 7.12% to Day's High of Rs 1040.95 — Outperforms Sector by 3.85 Percentage Points
The Sensex edged up 0.38% on 09 Jun 2026, but Gabriel India Ltd outperformed sharply with a 7.12% gain, reaching an intraday high of Rs 1040.95. This 3.85 percentage-point outperformance over the Auto Components & Equipments sector’s 2.11% advance signals a stock-specific strength rather than a broad market lift.
Read full news article
Gabriel India Ltd is Rated Hold
Gabriel India Ltd is rated 'Hold' by MarketsMOJO, with this rating last updated on 23 March 2026. While the rating change occurred on that date, the analysis and financial metrics discussed here reflect the stock's current position as of 09 June 2026, providing investors with an up-to-date perspective on the company’s fundamentals, valuation, financial trends, and technical outlook.
Read full news article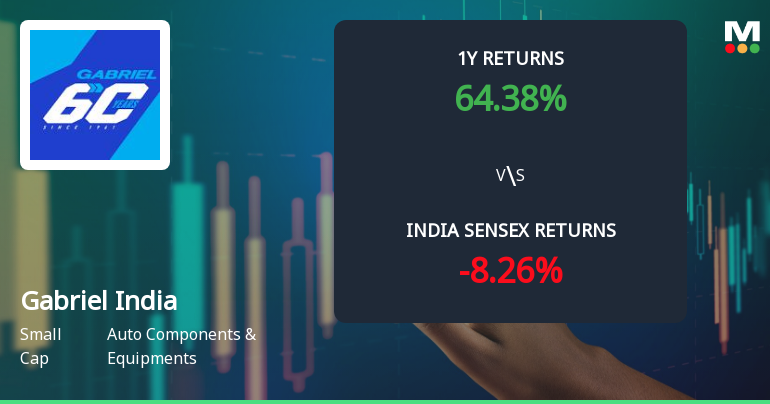
Gabriel India Ltd Technical Momentum Shifts Amid Mixed Indicator Signals
Gabriel India Ltd, a small-cap player in the Auto Components & Equipments sector, has experienced a subtle shift in its technical momentum, moving from a sideways trend to a mildly bearish stance. Despite this, certain weekly indicators continue to signal bullish tendencies, reflecting a complex interplay of market forces as the stock navigates current price levels near ₹1,078.
Read full news article Announcements
Announcement under Regulation 30 (LODR)-Earnings Call Transcript
03-Jun-2026 | Source : BSEIntimation of Earnings Call written transcript for Q4 & FY 26 held on May 28 2026
Disclosures under Reg. 10(6) of SEBI (SAST) Regulations 2011
29-May-2026 | Source : BSEThe Exchange has received the disclosure under Regulation 10(6) of SEBI (Substantial Acquisition of Shares & Takeovers) Regulations 2011 for Anjali Singh
Disclosures under Reg. 10(6) of SEBI (SAST) Regulations 2011
29-May-2026 | Source : BSEThe Exchange has received the disclosure under Regulation 10(6) of SEBI (Substantial Acquisition of Shares & Takeovers) Regulations 2011 for Anfilco Ltd
Corporate Actions

No Upcoming Board Meetings

Gabriel India Ltd has declared 190% dividend, ex-date: 21 Nov 25

No Splits history available

Gabriel India Ltd has announced 1:1 bonus issue, ex-date: 12 Jul 12

No Rights history available
Quality key factors
Valuation key factors
Technicals key factors
 Technical Indicator Scale: Bearish, Mildly Bearish, Sideways, Mildly Bullish, Bullish Turned
 Shareholding Snapshot : Mar 2026
Shareholding Compare (%holding)
Promoters
None
Held by 26 Schemes (15.48%)
Held by 126 FIIs (6.58%)
Asia Investments Private Limited (52.64%)
Hdfc Small Cap Fund (8.26%)
18.39%
Quarterly Results Snapshot (Consolidated) - Mar'26 - YoY

YoY Growth in quarter ended Mar 2026 is 12.71% vs 17.03% in Mar 2025
YoY Growth in quarter ended Mar 2026 is 3.33% vs 31.24% in Mar 2025
Half Yearly Results Snapshot (Consolidated) - Sep'25
Growth in half year ended Sep 2025 is 15.45% vs 18.17% in Sep 2024
Growth in half year ended Sep 2025 is 8.70% vs 36.40% in Sep 2024
Nine Monthly Results Snapshot (Consolidated) - Dec'25
YoY Growth in nine months ended Dec 2025 is 15.62% vs 20.30% in Dec 2024
YoY Growth in nine months ended Dec 2025 is 2.80% vs 39.37% in Dec 2024
Annual Results Snapshot (Consolidated) - Mar'26
YoY Growth in year ended Mar 2026 is 14.85% vs 19.42% in Mar 2025
YoY Growth in year ended Mar 2026 is 2.93% vs 37.05% in Mar 2025
About Gabriel India Ltd

Company Coordinates


