
Compare Belrise Industri with Similar Stocks
Dashboard
The company has declared Positive results for the last 4 consecutive quarters
- PAT(Latest six months) At Rs 255.82 cr has Grown at 21.46%
- OPERATING PROFIT TO INTEREST(Q) Highest at 6.38 times
- NET SALES(Q) Highest at Rs 2,552.83 cr
With ROCE of 13.4, it has a Attractive valuation with a 3.9 Enterprise value to Capital Employed
Increasing Participation by Institutional Investors
Market Beating Performance
Stock DNA
Auto Components & Equipments
INR 21,749 Cr (Small Cap)
44.00
37
0.22%
0.13
9.58%
4.22
Total Returns (Price + Dividend) 
Latest dividend: 0.55 per share ex-dividend date: Aug-22-2025
Risk Adjusted Returns v/s
Returns Beta

News
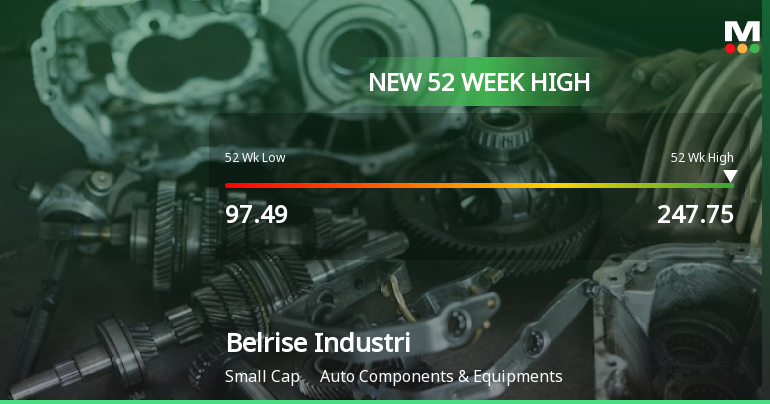
Broad-Based Technical Strength Lifts Belrise Industries Ltd to 52-Week High of Rs 247.75
Surging past its previous peaks, Belrise Industries Ltd touched a new 52-week high of Rs 247.75 on 22 Jun 2026, marking a remarkable 141.96% gain over the past year. This milestone comes amid a sustained rally fuelled by a confluence of strong technical indicators and robust price momentum.
Read full news article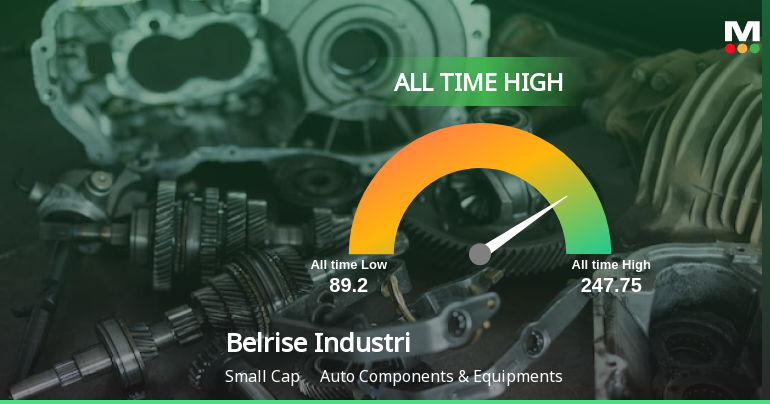

Belrise Industries Ltd is Rated Buy
Belrise Industries Ltd is rated 'Buy' by MarketsMOJO, with this rating last updated on 09 June 2026. However, the analysis and financial metrics discussed here reflect the stock's current position as of 21 June 2026, providing investors with the latest insights into its performance and outlook.
Read full news article Announcements
Appointment of Company Secretary and Compliance Officer
14-Jun-2026 | Source : BSEThe Belrise Industries Limited has informed the exchange regarding appointment of Company Secretary and Compliance Officer (KMP) of the Company.
Board Meeting Outcome for Appointment Of Company Secretary & Compliance Officer (KMP)
14-Jun-2026 | Source : BSEThe Belrise Industries Limited has submitted to the exchange outcome of Board Meeting.
Intimation Under Regulation 30 (5) Of The Securities And Exchange Board Of India (Listing Obligations And Disclosure Requirements Regulations) 2015
14-Jun-2026 | Source : BSEIntimation under Regulation 30(5) of the Securities and Exchange Board of India (Listing Obligation and Disclosure Requirements Regulations) 2015
Corporate Actions

No Upcoming Board Meetings

Belrise Industries Ltd has declared 11% dividend, ex-date: 22 Aug 25

No Splits history available

No Bonus history available

No Rights history available
Quality key factors
Valuation key factors
Technicals key factors
 Technical Indicator Scale: Bearish, Mildly Bearish, Sideways, Mildly Bullish, Bullish Turned
 Shareholding Snapshot : Mar 2026
Shareholding Compare (%holding)
Promoters
None
Held by 17 Schemes (8.86%)
Held by 80 FIIs (8.87%)
Shrikant Shankar Badve (59.56%)
Sbi Small Cap Fund (5.79%)
10.62%
Quarterly Results Snapshot (Consolidated) - Mar'26 - QoQ

QoQ Growth in quarter ended Mar 2026 is 9.07% vs -0.55% in Dec 2025
QoQ Growth in quarter ended Mar 2026 is 6.77% vs -8.28% in Dec 2025
Half Yearly Results Snapshot (Standalone) - Sep'25
Not Applicable: The company has declared_date for only one period
Not Applicable: The company has declared_date for only one period
Nine Monthly Results Snapshot (Standalone) - Dec'25
Not Applicable: The company has declared_date for only one period
Not Applicable: The company has declared_date for only one period
Annual Results Snapshot (Consolidated) - Mar'26
YoY Growth in year ended Mar 2026 is 14.69% vs 10.78% in Mar 2025
YoY Growth in year ended Mar 2026 is 39.79% vs 13.27% in Mar 2025
About Belrise Industries Ltd

Company Coordinates


