
Key Events This Week
29 Jun: Golden Cross formation signals potential bullish breakout
30 Jun: Mojo Grade upgraded to Sell on technical and valuation improvements
3 Jul: Week closes at Rs.2.01 (-0.50%) despite Sensex gains
Jul 17, 03:30 PM
BSE+NSE Vol: 1.97 lacs
Galactico Corpo. for the last several years.

29 Jun: Golden Cross formation signals potential bullish breakout
30 Jun: Mojo Grade upgraded to Sell on technical and valuation improvements
3 Jul: Week closes at Rs.2.01 (-0.50%) despite Sensex gains

Galactico Corporate Services Ltd has seen its investment rating upgraded from Strong Sell to Sell, driven primarily by improvements in technical indicators and valuation metrics. Despite persistent challenges in financial trends and quality parameters, the stock’s mildly bullish technical outlook and attractive valuation have prompted a reassessment of its market stance as of 29 June 2026.
Read full news article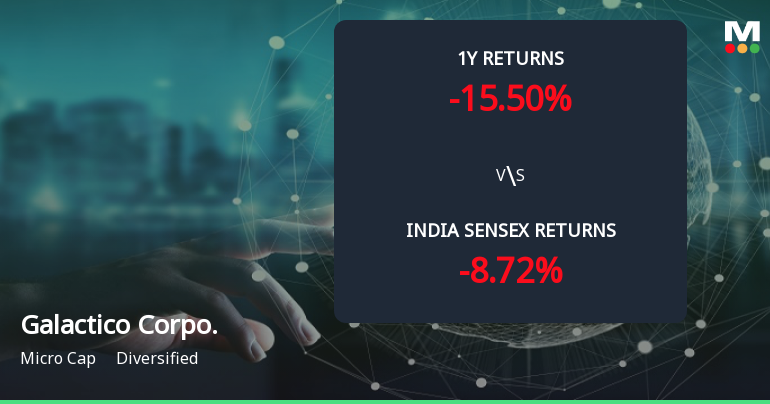
The 50-day moving average has crossed above the 200-day moving average for Galactico Corporate Services Ltd, signalling a golden cross on 29 Jun 2026. Yet, the broader technical and fundamental picture presents a nuanced story that tempers the enthusiasm this crossover might otherwise inspire.
Read full news articleFor raising funds through one or more permissible modes including but not limited to preferential issue of equity shares and/or warrants right issue qualified institution placement(QIP) private placement public issue debt instruments or any other permissible of securities.
Certificate under Regulation 74(5) of SEBI (Depositories and Participants) Regulations 2018 for the quarter ended June 302026.
Galactico Corporate Services Ltdhas informed BSE that the meeting of the Board of Directors of the Company is scheduled on 13/07/2026 inter alia to consider and approve The proposal for raising funds through one or more permissible modes including but not limited to preferential issue of equity shares and/or warrants right issue qualified institution placement(QIP) private placement public issue debt instruments or any other permissible of securities.

No Upcoming Board Meetings

No Dividend history available

Galactico Corporate Services Ltd has announced 1:10 stock split, ex-date: 16 Jun 22

Galactico Corporate Services Ltd has announced 3:10 bonus issue, ex-date: 16 Jun 22

Galactico Corporate Services Ltd has announced 23:100 rights issue, ex-date: 30 Jan 26
 Technical Indicator Scale: Bearish, Mildly Bearish, Sideways, Mildly Bullish, Bullish Turned
 Non Institution
None
Held by 0 Schemes
Held by 0 FIIs
Charushila Vipul Lathi (45.47%)
Mohammad Shami (1.8%)
52.98%

QoQ Growth in quarter ended Mar 2026 is -15.70% vs -28.27% in Dec 2025
QoQ Growth in quarter ended Mar 2026 is 86.96% vs -46.51% in Dec 2025
Growth in half year ended Sep 2025 is 3.23% vs 2.23% in Sep 2024

Growth in half year ended Sep 2025 is -26.40% vs 34.41% in Sep 2024
YoY Growth in nine months ended Dec 2025 is 4.97% vs 4.15% in Dec 2024
YoY Growth in nine months ended Dec 2025 is -41.62% vs 27.92% in Dec 2024
YoY Growth in year ended Mar 2026 is -9.35% vs 14.80% in Mar 2025
YoY Growth in year ended Mar 2026 is -33.05% vs 14.56% in Mar 2025


