
Compare Gallantt Ispat L with Similar Stocks
Dashboard
Company has a Debt to Equity ratio (avg) of 0.10 times
Healthy long term growth as Net Sales has grown by an annual rate of 34.42% and Operating profit at 43.79%
Flat results in Mar 26
With ROE of 14.7, it has a Expensive valuation with a 4.7 Price to Book Value
Despite the size of the company, domestic mutual funds hold only 0.25% of the company
Consistent Returns over the last 3 years
Stock DNA
Iron & Steel Products
INR 16,325 Cr (Small Cap)
32.00
26
0.17%
0.01
14.65%
4.99
Total Returns (Price + Dividend) 
Latest dividend: 1.2 per share ex-dividend date: Sep-12-2025
Risk Adjusted Returns v/s
Returns Beta

News
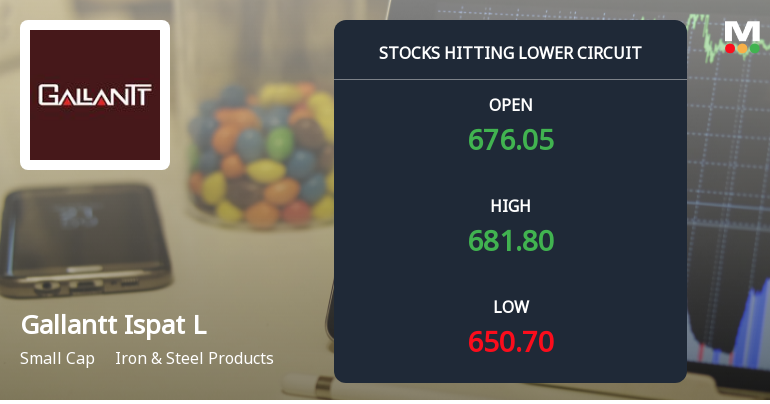
Gallantt Ispat Ltd. Locks at Lower Circuit With 5% Loss — Sellers Queue, No Buyers in Sight
At Rs 651.7, sellers were still queuing — but there were no buyers willing to take the other side. Gallantt Ispat Ltd. locked at its lower circuit of 5% on 17 Jul 2026, with unfilled sell orders and a frozen price, signalling a pronounced imbalance between supply and demand.
Read full news article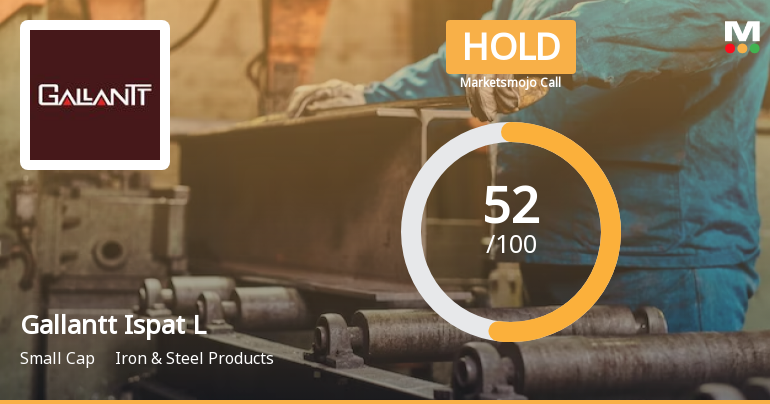
Gallantt Ispat Ltd. is Rated Hold
Gallantt Ispat Ltd. is rated 'Hold' by MarketsMOJO, with this rating last updated on 07 April 2026. However, the analysis and financial metrics discussed here reflect the stock's current position as of 16 July 2026, providing investors with an up-to-date view of the company’s performance and outlook.
Read full news article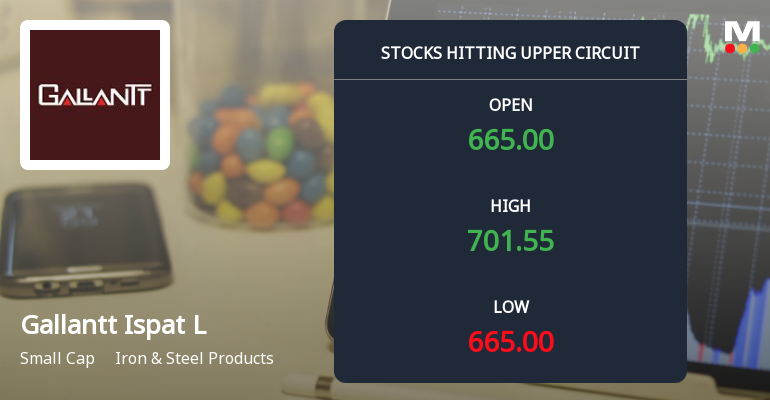
Gallantt Ispat Ltd. Locks at Upper Circuit With 5.0% Gain — Buyers Queue, Sellers Absent
At Rs 700.95, the buying was done — not because demand dried up, but because the exchange wouldn't let the stock go any higher. Gallantt Ispat Ltd. locked at its upper circuit of 5.0% on 13 Jul 2026, with buyers queuing and no sellers willing to part with shares.
Read full news article Announcements
Gallantt Metal Limited - Updates
23-Oct-2019 | Source : NSEGallantt Metal Limited has informed the Exchange regarding 'SUBMISSION OF BRIEF PROFILE W.R.T. APPOINTMENT OF MR. ARNAB BANERJI (M.No. A59335) AS A COMPANY SECRETARY AND COMPLIANCE OFFICER OF THE COMPANY '.
Gallantt Metal Limited - Updates
17-Oct-2019 | Source : NSEGallantt Metal Limited has informed the Exchange regarding 'SUBMISSION OF CERTIFICATE UNDER REGULATION 74(5) OF THE SEBI (DEPOSITORIES AND PARTICIPANTS) REGULATIONS, 2018 FOR THE QUARTER ENDED SEPTEMBER 30, 2019'.
Price movement
05-Sep-2019 | Source : NSE
| Significant movement in price has been observed in Gallantt Metal Limited. The Exchange, in order to ensure that investors have latest relevant information about the company and to inform the market place so that the interest of the investors is safeguarded, had written to the company. Gallantt Metal Limited has submitted their response. |
Corporate Actions

No Upcoming Board Meetings

Gallantt Ispat Ltd. has declared 12% dividend, ex-date: 12 Sep 25

No Splits history available

No Bonus history available

No Rights history available
Quality key factors
Valuation key factors
Technicals key factors
 Technical Indicator Scale: Bearish, Mildly Bearish, Sideways, Mildly Bullish, Bullish Turned
 Shareholding Snapshot : Mar 2026
Shareholding Compare (%holding)
Promoters
None
Held by 16 Schemes (0.08%)
Held by 9 FIIs (0.09%)
Gallantt Trust (60.05%)
Nihon Impex Private Limited (17.61%)
9.83%
Quarterly Results Snapshot (Consolidated) - Mar'26 - QoQ

QoQ Growth in quarter ended Mar 2026 is 12.22% vs 6.01% in Dec 2025
QoQ Growth in quarter ended Mar 2026 is 22.33% vs 12.91% in Dec 2025
Half Yearly Results Snapshot (Consolidated) - Sep'25

Growth in half year ended Sep 2025 is 1.82% vs 5.85% in Sep 2024
Growth in half year ended Sep 2025 is 53.85% vs 118.98% in Sep 2024
Nine Monthly Results Snapshot (Consolidated) - Dec'25
YoY Growth in nine months ended Dec 2025 is -0.20% vs 5.64% in Dec 2024
YoY Growth in nine months ended Dec 2025 is 27.67% vs 118.86% in Dec 2024
Annual Results Snapshot (Consolidated) - Mar'26
YoY Growth in year ended Mar 2026 is 2.94% vs 1.55% in Mar 2025
YoY Growth in year ended Mar 2026 is 20.84% vs 77.83% in Mar 2025
About Gallantt Ispat Ltd.

Company Coordinates


