
Compare Jindal Saw with Similar Stocks
Dashboard
Poor long term growth as Net Sales has grown by an annual rate of 8.93% and Operating profit at 5.06% over the last 5 years
With a fall in Net Sales of -3.91%, the company declared Very Negative results in Jun 26
With ROCE of 9.5, it has a Attractive valuation with a 1.3 Enterprise value to Capital Employed
Increasing Participation by Institutional Investors
Stock DNA
Iron & Steel Products
INR 17,037 Cr (Small Cap)
26.00
26
0.75%
0.33
7.74%
1.37
Total Returns (Price + Dividend) 
Latest dividend: 2.0004545454545455 per share ex-dividend date: May-22-2026
Risk Adjusted Returns v/s
Returns Beta

News
Jindal Saw Ltd is Rated Hold by MarketsMOJO
Jindal Saw Ltd is rated 'Hold' by MarketsMOJO, a rating that was last updated on 17 Apr 2026. While this rating change occurred in April, the analysis and financial metrics discussed here reflect the company’s current position as of 17 July 2026, providing investors with the latest insights into the stock’s performance and outlook.
Read full news articleAre Jindal Saw Ltd latest results good or bad?
Jindal Saw Ltd's latest financial results for Q1 FY27 highlight significant operational challenges, particularly in profitability metrics. The company reported consolidated net sales of ₹4,452.31 crores, reflecting a year-on-year growth of 9.00%, although this was accompanied by a sequential decline of 3.91% from the previous quarter. This suggests a weakening demand momentum as the fiscal year progresses. However, the key concern lies in the substantial drop in consolidated net profit, which fell to ₹104.17 crores, marking a dramatic year-on-year decrease of 75.43% and a sequential decline of 25.29%. This sharp decline underscores the company's struggle to convert revenue growth into profit, as evidenced by the operating margin (excluding other income) which contracted to 8.91%, down from 16.41% a year ago and 10.38% in the preceding quarter. This represents the lowest operating margin recorded in the ava...
Read full news article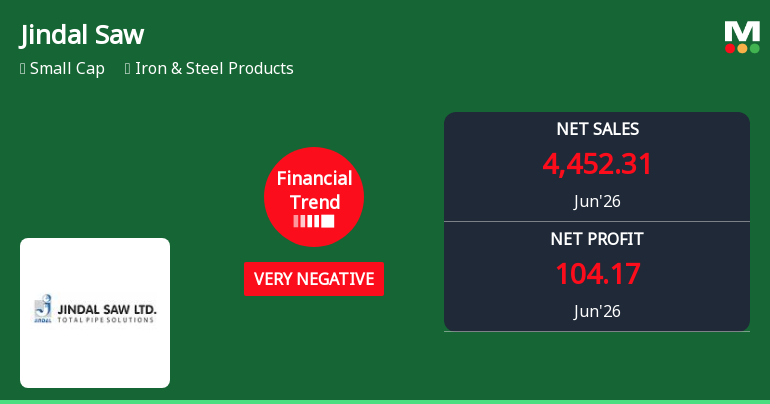
Jindal Saw Ltd Reports Sharp Decline in Quarterly Performance Amid Financial Strains
Jindal Saw Ltd, a key player in the Iron & Steel Products sector, has reported a significant deterioration in its financial performance for the quarter ended June 2026. Despite a strong year-to-date stock return of 53.99%, the company’s latest quarterly results reveal troubling declines in profitability and operational efficiency, prompting a downgrade in its Mojo Grade from Sell to Hold.
Read full news article Announcements
Jindal Saw Limited - Updates
01-Nov-2019 | Source : NSEJindal Saw Limited has informed the Exchange regarding 'Certificate by the Debenture Trustee under Regulations 52(5) of the SEBI (Listing Obligations and Disclosure Requirements) Regulations. 2015 (Listing Regulations)'.
Jindal Saw Limited - Updates
31-Oct-2019 | Source : NSEJindal Saw Limited has informed the Exchange regarding 'Intimation of reconstitution of various committees of Board of Directors - Regulation 30 of Securities Exchange Board of India (Listing Obligations and Disclosure Requirements) Regulations, 2015'.
Jindal Saw Limited - Shareholders meeting
25-Sep-2019 | Source : NSEJindal Saw Limited has informed the Exchange with copy of minutes of Annual General Meeting held on September 09, 2019
Corporate Actions

No Upcoming Board Meetings

Jindal Saw Ltd has declared 200% dividend, ex-date: 22 May 26

Jindal Saw Ltd has announced 1:2 stock split, ex-date: 09 Oct 24

No Bonus history available

No Rights history available
Quality key factors
Valuation key factors
Technicals key factors
 Technical Indicator Scale: Bearish, Mildly Bearish, Sideways, Mildly Bullish, Bullish Turned
 Shareholding Snapshot : Mar 2026
Shareholding Compare (%holding)
Promoters
21.5253
Held by 55 Schemes (5.4%)
Held by 182 FIIs (13.46%)
Nalwa Sons Investments Limited (16.75%)
Theleme India Master Fund Limited (2.31%)
13.97%
Quarterly Results Snapshot (Consolidated) - Jun'26 - QoQ

QoQ Growth in quarter ended Jun 2026 is -3.91% vs -6.27% in Mar 2026
QoQ Growth in quarter ended Jun 2026 is -25.29% vs -45.96% in Mar 2026
Half Yearly Results Snapshot (Consolidated) - Sep'25

Growth in half year ended Sep 2025 is -20.86% vs 6.42% in Sep 2024
Growth in half year ended Sep 2025 is -38.77% vs 46.60% in Sep 2024
Nine Monthly Results Snapshot (Consolidated) - Dec'25
YoY Growth in nine months ended Dec 2025 is -15.97% vs 1.61% in Dec 2024
YoY Growth in nine months ended Dec 2025 is -42.37% vs 23.17% in Dec 2024
Annual Results Snapshot (Consolidated) - Mar'26
YoY Growth in year ended Mar 2026 is -14.08% vs -0.61% in Mar 2025
YoY Growth in year ended Mar 2026 is -44.01% vs 3.66% in Mar 2025
About Jindal Saw Ltd

Company Coordinates


