
Compare Ganesha Ecosphe. with Similar Stocks
Dashboard
Poor long term growth as Net Sales has grown by an annual rate of 14.55% and Operating profit at 6.05% over the last 5 years
Flat results in Mar 26
With ROCE of 4.7, it has a Expensive valuation with a 1.9 Enterprise value to Capital Employed
31.87% of Promoter Shares are Pledged
Below par performance in long term as well as near term
Stock DNA
Garments & Apparels
INR 2,625 Cr (Small Cap)
72.00
26
0.33%
0.29
3.00%
1.92
Total Returns (Price + Dividend) 
Latest dividend: 3 per share ex-dividend date: Sep-19-2025
Risk Adjusted Returns v/s
Returns Beta

News
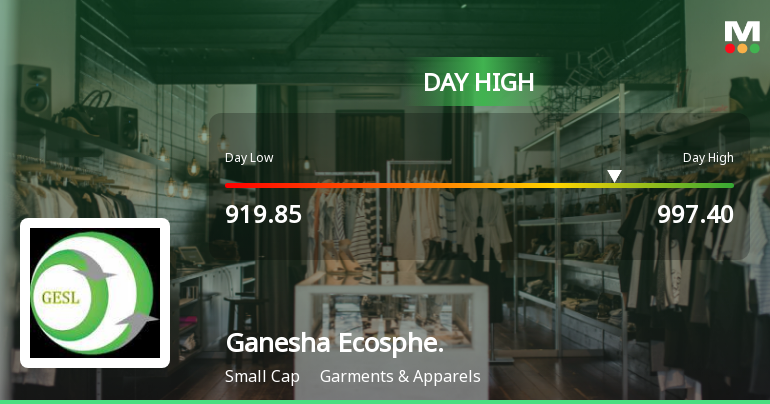
Ganesha Ecosphere Ltd Surges 7.71% to Day's High of Rs 997.4 — Outperforms Sector by 7.58 Percentage Points
The Sensex gained 0.65% on 3 Jul 2026, but Ganesha Ecosphere Ltd surged 7.71%, touching an intraday high of Rs 997.4. This 7.58-percentage-point outperformance over its Garments & Apparels sector peers signals a distinctly stock-specific rally rather than a broad market lift.
Read full news article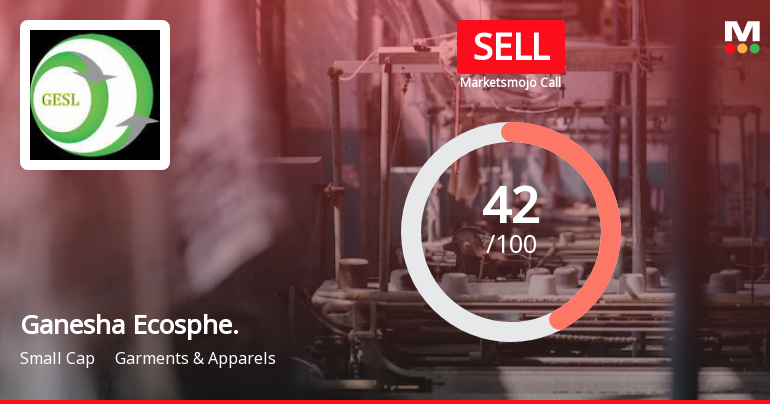
Ganesha Ecosphere Ltd is Rated Sell
Ganesha Ecosphere Ltd is rated Sell by MarketsMOJO, with this rating last updated on 16 June 2026. However, the analysis and financial metrics discussed here reflect the company’s current position as of 28 June 2026, providing investors with the latest insights into the stock’s fundamentals, valuation, financial trends, and technical outlook.
Read full news article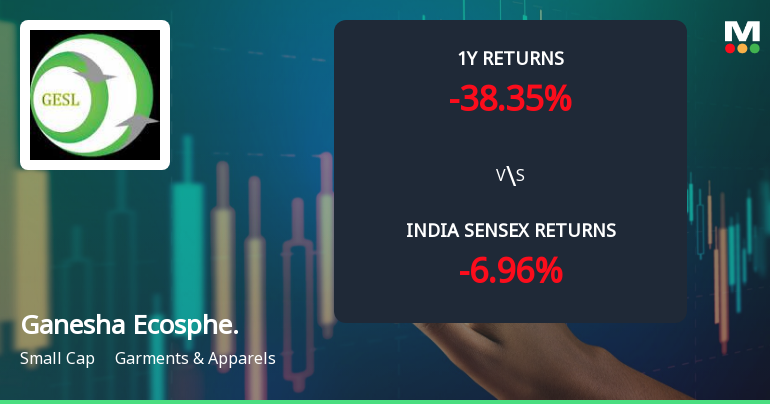
Ganesha Ecosphere Ltd Faces Technical Downshift Amid Mixed Momentum Signals
Ganesha Ecosphere Ltd, a small-cap player in the Garments & Apparels sector, has experienced a notable shift in its technical momentum, with key indicators signalling a transition from sideways to mildly bearish trends. Despite a year-to-date return of 6.07%, the stock’s recent technical deterioration and a downgrade in its Mojo Grade to Sell highlight growing caution among investors.
Read full news article Announcements
Ganesha Ecosphere Limited - Updates
21-Nov-2019 | Source : NSEGanesha Ecosphere Limited has informed the Exchange regarding 'Incorporation of Wholly Owned Subsidiary of the Company'.
Ganesha Ecosphere Limited - Updates
13-Nov-2019 | Source : NSEGanesha Ecosphere Limited has informed the Exchange regarding 'Newspaper clippings of Extract of Unaudited Financial Results for the Quarter and half year ended September 30, 2019'.
Ganesha Ecosphere Limited - Updates
16-Oct-2019 | Source : NSEGanesha Ecosphere Limited has informed the Exchange regarding 'Certificate under Regulation 74(5) of SEBI (Depositories and Participants) Regulations, 2018 for the quarter ended September 30, 2019 '.
Corporate Actions

No Upcoming Board Meetings

Ganesha Ecosphere Ltd has declared 30% dividend, ex-date: 19 Sep 25

No Splits history available

No Bonus history available

No Rights history available
Quality key factors
Valuation key factors
Technicals key factors
 Technical Indicator Scale: Bearish, Mildly Bearish, Sideways, Mildly Bullish, Bullish Turned
 Shareholding Snapshot : Mar 2026
Shareholding Compare (%holding)
Promoters
31.868
Held by 12 Schemes (19.14%)
Held by 41 FIIs (8.89%)
Gpl Finance Ltd (13.67%)
Sbi Mutual Fund (8.79%)
21.33%
Quarterly Results Snapshot (Consolidated) - Mar'26 - QoQ

QoQ Growth in quarter ended Mar 2026 is 18.68% vs -1.70% in Dec 2025

QoQ Growth in quarter ended Mar 2026 is 388.63% vs 1,050.00% in Dec 2025
Half Yearly Results Snapshot (Consolidated) - Sep'25
Growth in half year ended Sep 2025 is -3.16% vs 35.82% in Sep 2024
Growth in half year ended Sep 2025 is -79.36% vs 694.56% in Sep 2024
Nine Monthly Results Snapshot (Consolidated) - Dec'25
YoY Growth in nine months ended Dec 2025 is -5.66% vs 37.16% in Dec 2024
YoY Growth in nine months ended Dec 2025 is -81.10% vs 318.18% in Dec 2024
Annual Results Snapshot (Consolidated) - Mar'26
YoY Growth in year ended Mar 2026 is 1.10% vs 30.51% in Mar 2025
YoY Growth in year ended Mar 2026 is -62.95% vs 154.18% in Mar 2025
About Ganesha Ecosphere Ltd

Company Coordinates


