
Compare Garuda Cons with Similar Stocks
Dashboard
The company is Net-Debt Free
Healthy long term growth as Net Sales has grown by an annual rate of 48.90% and Operating profit at 43.71%
With a growth in Net Sales of 6.43%, the company declared Very Positive results in Mar 26
With ROE of 27, it has a Fair valuation with a 3.3 Price to Book Value
Despite the size of the company, domestic mutual funds hold only 1.31% of the company
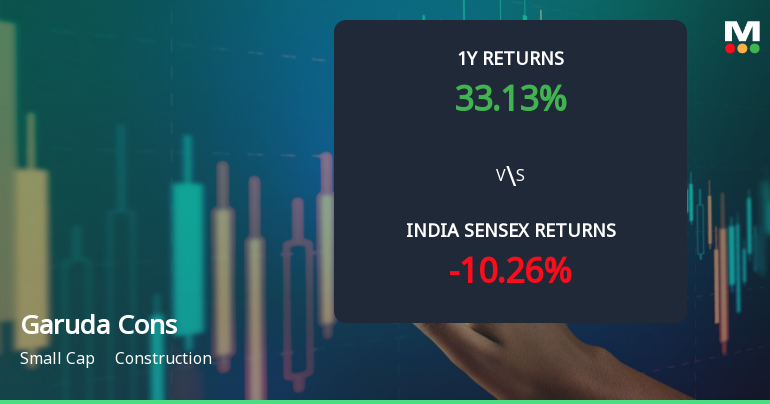
Market Beating Performance
Stock DNA
Construction
INR 1,498 Cr (Small Cap)
12.00
33
0.00%
-0.02
26.97%
3.34
Total Returns (Price + Dividend) 
Latest dividend: 0 per share ex-dividend date: Feb-17-2025
Risk Adjusted Returns v/s
Returns Beta

News
Garuda Construction and Engineering Ltd Faces Mildly Bearish Momentum Amid Technical Shifts
Garuda Construction and Engineering Ltd has experienced a notable shift in its technical momentum, moving from a sideways trend to a mildly bearish stance. Despite some bullish signals on weekly indicators, the overall technical picture suggests caution for investors as the stock faces downward pressure amid a challenging market environment.
Read full news article
Garuda Construction and Engineering Ltd Downgraded to Sell Amid Valuation and Technical Concerns
Garuda Construction and Engineering Ltd has seen its investment rating downgraded from Hold to Sell as of 2 June 2026, driven primarily by a deterioration in technical indicators and a shift to an expensive valuation grade. Despite robust financial performance and strong returns over the past year, the company’s technical outlook and valuation metrics have raised caution among analysts, prompting a reassessment of its investment appeal.
Read full news article
Garuda Construction and Engineering Ltd Faces Mildly Bearish Technical Shift Amid Mixed Momentum
Garuda Construction and Engineering Ltd has experienced a subtle shift in its technical momentum, moving from a mildly bullish to a mildly bearish stance. Despite a recent downgrade from a Buy to a Hold rating, the stock’s mixed technical indicators and price action suggest a nuanced outlook for investors navigating the construction sector’s evolving landscape.
Read full news article Announcements
Announcement under Regulation 30 (LODR)-Change in Management
09-Jun-2026 | Source : BSEGaruda Construction and Engineering Limited has informed the Stock Exchange about the Change in Management of the Company.
Shareholder Meeting / Postal Ballot-Scrutinizers Report
08-Jun-2026 | Source : BSEResults of Postal Ballot pursuant to Regulation 44(3) of SEBI (Listing Obligations and Disclosure Requirements) Regulations 2015
Shareholder Meeting / Postal Ballot-Outcome of Postal_Ballot
08-Jun-2026 | Source : BSEOutcome of the Postal ballot is hereby enclosed
Corporate Actions

No Upcoming Board Meetings


No Splits history available

No Bonus history available

No Rights history available
Quality key factors
Valuation key factors
Technicals key factors
 Technical Indicator Scale: Bearish, Mildly Bearish, Sideways, Mildly Bullish, Bullish Turned
 Shareholding Snapshot : Mar 2026
Shareholding Compare (%holding)
Promoters
None
Held by 1 Schemes (0.42%)
Held by 10 FIIs (2.64%)
Pkh Ventures Limited (51.7%)
Yash Shares And Stock Private Limited (3.98%)
20.96%
Quarterly Results Snapshot (Standalone) - Mar'26 - QoQ

QoQ Growth in quarter ended Mar 2026 is 6.43% vs 20.26% in Dec 2025
QoQ Growth in quarter ended Mar 2026 is 4.40% vs 21.48% in Dec 2025
Half Yearly Results Snapshot (Standalone) - Sep'25

Growth in half year ended Sep 2025 is 195.08% vs 124.82% in Sep 2024
Growth in half year ended Sep 2025 is 191.95% vs 113.45% in Sep 2024
Nine Monthly Results Snapshot (Standalone) - Dec'25
YoY Growth in nine months ended Dec 2025 is 164.86% vs 53.43% in Dec 2024
YoY Growth in nine months ended Dec 2025 is 177.46% vs 39.97% in Dec 2024
Annual Results Snapshot (Standalone) - Mar'26
YoY Growth in year ended Mar 2026 is 135.84% vs 45.95% in Mar 2025
YoY Growth in year ended Mar 2026 is 146.06% vs 36.66% in Mar 2025
About Garuda Construction and Engineering Ltd

Company Coordinates


