
Compare Garware Tech with Similar Stocks
Stock DNA
Garments & Apparels
INR 6,760 Cr (Small Cap)
33.00
23
1.38%
-0.28
15.42%
5.05
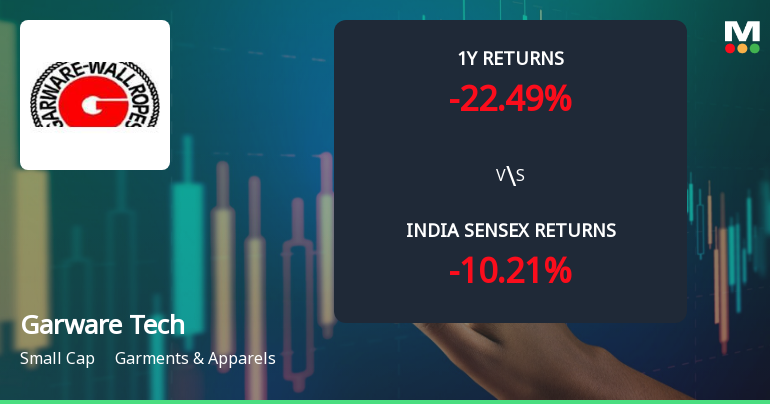
Total Returns (Price + Dividend) 
Latest dividend: 8 per share ex-dividend date: Nov-14-2025
Risk Adjusted Returns v/s
Returns Beta

News
Garware Technical Fibres Ltd: Technical Momentum Shifts Amid Mixed Market Signals
Garware Technical Fibres Ltd, a small-cap player in the Garments & Apparels sector, has recently exhibited a shift in its technical momentum, moving from a mildly bearish stance to a sideways trend. Despite a modest day gain of 0.38%, the stock’s technical indicators present a nuanced picture, with weekly signals leaning mildly bullish while monthly trends remain bearish. This article analyses the key technical parameters shaping the stock’s near-term outlook and compares its performance against the broader Sensex benchmark.
Read full news article
Garware Technical Fibres Ltd is Rated Sell
Garware Technical Fibres Ltd is rated 'Sell' by MarketsMOJO, with this rating last updated on 04 May 2026. However, the analysis and financial metrics discussed here reflect the stock's current position as of 08 June 2026, providing investors with the latest insights into its performance and outlook.
Read full news article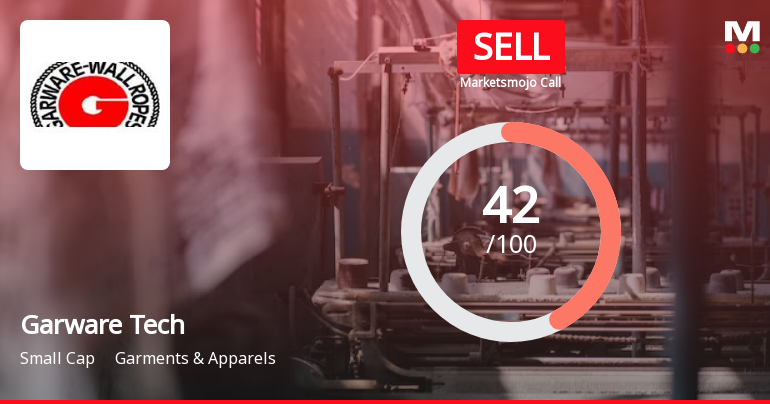
Garware Technical Fibres Ltd is Rated Sell
Garware Technical Fibres Ltd is rated 'Sell' by MarketsMOJO, with this rating last updated on 04 May 2026. However, the analysis and financial metrics discussed here reflect the stock's current position as of 08 June 2026, providing investors with the latest insights into its performance and outlook.
Read full news article Announcements
Announcement under Regulation 30 (LODR)-Investor Presentation
24-May-2026 | Source : BSEIn continuation to our letter dated May 20 2026 please find enclosed the copy of the presentation to investor / analyst meet / conference.
Submission Of Letter Of Offer Dated May 22 2026 In Relation To The Buyback Of Not Exceeding 1617500 Fully Paid-Up Equity Shares Of Face Value Of Rs 10 Each Of The Company At A Price Of Rs 680 Per Equity Share Through The Tender Offer Process
22-May-2026 | Source : BSEPlease find enclosed the Letter of Offer Dated May 22 2026 along with the Tender Forms for demat and physical shareholders which is being dispatched by the Company to the Eligible Shareholders as on the Record Date being Wednesday May 20 2026. You are requested to take note of the attached schedule of activities in relation to the Buyback.
Announcement under Regulation 30 (LODR)-Newspaper Publication
21-May-2026 | Source : BSEPursuant to Regulation 30 read with Schedule III of the SEBI (Listing Obligations and Disclosure Requirements) regulations 2015 please find enclosed herewith the copy of newspaper advertisment published in Business Standard (All India) and Loksatta (Pune) editions on Thursday 21st May 2026
Corporate Actions

No Upcoming Board Meetings

Garware Technical Fibres Ltd has declared 80% dividend, ex-date: 14 Nov 25

No Splits history available

Garware Technical Fibres Ltd has announced 4:1 bonus issue, ex-date: 03 Jan 25

No Rights history available
Quality key factors
Valuation key factors
Technicals key factors
 Technical Indicator Scale: Bearish, Mildly Bearish, Sideways, Mildly Bullish, Bullish Turned
 Shareholding Snapshot : Mar 2026
Shareholding Compare (%holding)
Promoters
None
Held by 7 Schemes (9.4%)
Held by 92 FIIs (9.12%)
Garware Capital Markets Limited (18.34%)
Kotak Small Cap Fund (5.71%)
20.07%
Quarterly Results Snapshot (Consolidated) - Mar'26 - QoQ

QoQ Growth in quarter ended Mar 2026 is 10.11% vs 11.31% in Dec 2025
QoQ Growth in quarter ended Mar 2026 is 1.63% vs 76.12% in Dec 2025
Half Yearly Results Snapshot (Consolidated) - Sep'25
Growth in half year ended Sep 2025 is -5.51% vs 15.73% in Sep 2024
Growth in half year ended Sep 2025 is -24.52% vs 18.11% in Sep 2024
Nine Monthly Results Snapshot (Consolidated) - Dec'25
YoY Growth in nine months ended Dec 2025 is -0.47% vs 17.41% in Dec 2024
YoY Growth in nine months ended Dec 2025 is -11.88% vs 15.70% in Dec 2024
Annual Results Snapshot (Consolidated) - Mar'26
YoY Growth in year ended Mar 2026 is -0.74% vs 16.18% in Mar 2025
YoY Growth in year ended Mar 2026 is -14.20% vs 10.12% in Mar 2025
About Garware Technical Fibres Ltd

Company Coordinates


