
Compare V2 Retail with Similar Stocks
Dashboard
Low ability to service debt as the company has a high Debt to EBITDA ratio of 2.18 times
- Low ability to service debt as the company has a high Debt to EBITDA ratio of 2.18 times
- The company has been able to generate a Return on Equity (avg) of 9.31% signifying low profitability per unit of shareholders funds
Healthy long term growth as Net Sales has grown by an annual rate of 41.61% and Operating profit at 109.81%
With a growth in Net Profit of 171.89%, the company declared Very Positive results in Mar 26
With ROCE of 14.5, it has a Fair valuation with a 4.9 Enterprise value to Capital Employed
Stock DNA
Garments & Apparels
INR 8,447 Cr (Small Cap)
59.00
77
0.00%
1.09
15.68%
9.41
Total Returns (Price + Dividend) 
V2 Retail for the last several years.
Risk Adjusted Returns v/s
Returns Beta

News

V2 Retail Ltd Downgraded to Hold Amid Mixed Technical and Financial Signals
V2 Retail Ltd, a prominent player in the Garments & Apparels sector, has seen its investment rating downgraded from Buy to Hold as of 23 June 2026. This adjustment reflects a nuanced reassessment across four critical parameters: quality, valuation, financial trend, and technical indicators. Despite robust financial performance and impressive long-term returns, evolving technical signals and valuation considerations have prompted a more cautious stance.
Read full news article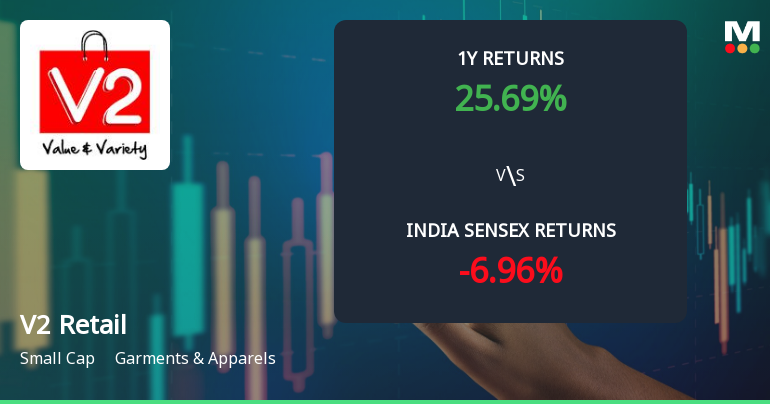
V2 Retail Ltd Technical Momentum Shifts Amid Mixed Indicator Signals
V2 Retail Ltd, a small-cap player in the Garments & Apparels sector, has experienced a nuanced shift in its technical momentum, reflecting a complex interplay of bullish and bearish signals across multiple timeframes. Despite a recent downgrade in its Mojo Grade from Buy to Hold, the stock’s price action and technical indicators suggest a cautiously optimistic outlook amid sectoral and market headwinds.
Read full news article
V2 Retail Ltd Upgraded to Buy on Strong Financials and Bullish Technicals
V2 Retail Ltd has been upgraded from a Hold to a Buy rating, reflecting significant improvements across quality, valuation, financial trends, and technical indicators. The company’s robust quarterly results, sustained growth trajectory, and positive technical signals have collectively driven this reassessment, positioning it favourably within the Garments & Apparels sector.
Read full news article Announcements
Announcement under Regulation 30 (LODR)-Earnings Call Transcript
02-Jun-2026 | Source : BSEThe details are attached herewith.
Announcement under Regulation 30 (LODR)-Analyst / Investor Meet - Outcome
30-May-2026 | Source : BSEThe details are attached herewith.
Intimation Of Book Closure For The Purpose Of Annual General Meeting
28-May-2026 | Source : BSEThe details are attached herewith.
Corporate Actions

No Upcoming Board Meetings

No Dividend history available

V2 Retail Ltd has announced 1:10 stock split, ex-date: 25 Mar 26

No Bonus history available

No Rights history available
Quality key factors
Valuation key factors
Technicals key factors
 Technical Indicator Scale: Bearish, Mildly Bearish, Sideways, Mildly Bullish, Bullish Turned
 Shareholding Snapshot : Mar 2026
Shareholding Compare (%holding)
Promoters
1.7862
Held by 9 Schemes (8.34%)
Held by 75 FIIs (2.59%)
Ricon Commodities Private Limited (35.28%)
Motilal Oswal Large And Midcap Fund (7.11%)
28.07%
Quarterly Results Snapshot (Consolidated) - Mar'26 - YoY

YoY Growth in quarter ended Mar 2026 is 59.88% vs 68.39% in Mar 2025

YoY Growth in quarter ended Mar 2026 is 171.89% vs 78.89% in Mar 2025
Half Yearly Results Snapshot (Consolidated) - Sep'25
Growth in half year ended Sep 2025 is 68.65% vs 60.64% in Sep 2024
Growth in half year ended Sep 2025 is 190.90% vs 2,566.67% in Sep 2024
Nine Monthly Results Snapshot (Consolidated) - Dec'25
YoY Growth in nine months ended Dec 2025 is 63.79% vs 59.55% in Dec 2024
YoY Growth in nine months ended Dec 2025 is 120.38% vs 172.04% in Dec 2024
Annual Results Snapshot (Consolidated) - Mar'26
YoY Growth in year ended Mar 2026 is 62.75% vs 61.80% in Mar 2025
YoY Growth in year ended Mar 2026 is 124.99% vs 159.01% in Mar 2025
About V2 Retail Ltd

Company Coordinates


