
Compare Gaudium IVF with Similar Stocks
Total Returns (Price + Dividend) 
Gaudium IVF for the last several years.
Risk Adjusted Returns v/s
Returns Beta

News

Gaudium IVF and Women Health Ltd Faces Technical Momentum Shift Amid Market Pressure
Gaudium IVF and Women Health Ltd has experienced a notable shift in its technical momentum, moving from a mildly bullish to a mildly bearish trend. This change is underscored by a series of technical indicator signals, including the MACD, RSI, and moving averages, which collectively suggest increasing downside pressure on the stock amid broader market challenges.
Read full news article
Gaudium IVF and Women Health Ltd: Technical Momentum Shifts Amid Micro-Cap Healthcare Sector Challenges
Gaudium IVF and Women Health Ltd, a micro-cap player in the healthcare services sector, has exhibited a subtle shift in its technical momentum, moving from a sideways trend to a mildly bullish stance. Despite a recent dip in price, the stock’s technical indicators suggest a cautiously optimistic outlook, warranting close attention from investors seeking nuanced signals in a volatile market environment.
Read full news article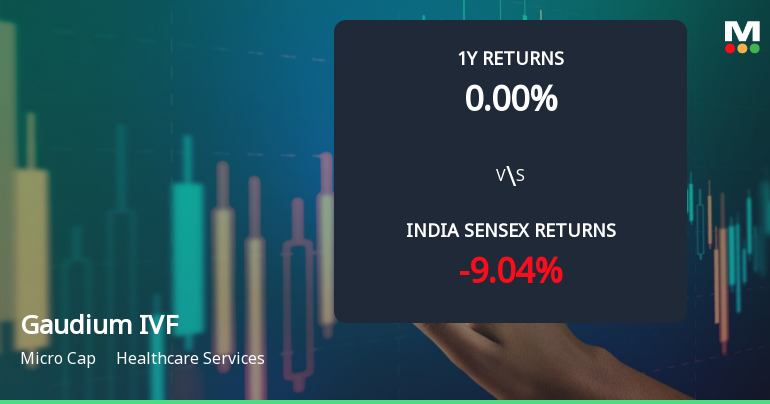
Gaudium IVF and Women Health Ltd Technical Momentum Shifts Amid Sideways Trend
Gaudium IVF and Women Health Ltd, a micro-cap player in the healthcare services sector, has experienced a notable shift in its technical momentum, moving from a mildly bullish stance to a sideways trend. This change is underscored by mixed signals from key technical indicators such as MACD, RSI, and moving averages, reflecting a cautious market sentiment amid recent price fluctuations.
Read full news article Announcements
Corporate Actions

No Upcoming Board Meetings

No Dividend history available

No Splits history available

No Bonus history available

No Rights history available
Quality key factors
Valuation key factors
Technicals key factors
 Technical Indicator Scale: Bearish, Mildly Bearish, Sideways, Mildly Bullish, Bullish Turned
 Shareholding Snapshot : Mar 2026
Shareholding Compare (%holding)
Promoters
None
Held by 0 Schemes
Held by 6 FIIs (6.7%)
Manika Khanna (70.73%)
Mukul Mahavir Agrawal (3.43%)
14.67%
Quarterly Results Snapshot (Standalone) - Mar'26 - QoQ

QoQ Growth in quarter ended Mar 2026 is 56.24% vs -38.17% in Dec 2025
QoQ Growth in quarter ended Mar 2026 is 143.08% vs -64.78% in Dec 2025
Annual Results Snapshot (Standalone) - Mar'26
YoY Growth in year ended Mar 2026 is 21.32% vs 12.98% in Mar 2025
YoY Growth in year ended Mar 2026 is 19.65% vs 11.96% in Mar 2025
About Gaudium IVF and Women Health Ltd

Company Coordinates


