
Compare GE Power with Similar Stocks
Dashboard
Weak Long Term Fundamental Strength with a -17.61% CAGR growth in Net Sales over the last 5 years
- Low ability to service debt as the company has a high Debt to EBITDA ratio of 0.07 times
With a growth in Net Profit of 43.15%, the company declared Very Positive results in Mar 26
With ROE of 59.8, it has a Expensive valuation with a 8.4 Price to Book Value
Despite the size of the company, domestic mutual funds hold only 0.42% of the company
Stock DNA
Heavy Electrical Equipment
INR 5,128 Cr (Small Cap)
14.00
42
0.00%
-0.71
59.80%
8.60
Total Returns (Price + Dividend) 
Latest dividend: 1 per share ex-dividend date: Aug-02-2021
Risk Adjusted Returns v/s
Returns Beta

News

GE Power India Ltd Locks at Upper Circuit With 4.03% Gain — Buyers Queue, Sellers Absent
At Rs 769.25, the buying was done — not because demand dried up, but because the exchange wouldn't let the stock go any higher. GE Power India Ltd locked at its upper circuit of 4.03% on 31 Jul 2026, with buyers queuing and no sellers willing to part with shares.
Read full news article
GE Power India Ltd Upgraded to Hold as Valuation and Financials Improve
GE Power India Ltd has seen its investment rating upgraded from Sell to Hold as of 28 July 2026, reflecting a notable improvement in valuation metrics and financial performance. Despite a recent day decline of 4.81%, the company’s robust quarterly results and attractive valuation relative to peers have prompted a reassessment of its market standing within the Heavy Electrical Equipment sector.
Read full news article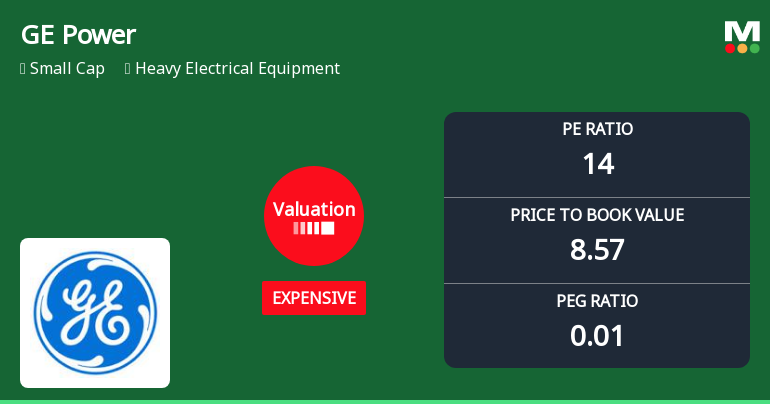
GE Power India Ltd Valuation Shifts Signal Renewed Price Attractiveness Amid Market Volatility
GE Power India Ltd has witnessed a notable shift in its valuation parameters, moving from a very expensive to an expensive rating, reflecting evolving investor perceptions amid strong operational metrics and a volatile market backdrop. This article analyses the recent changes in key valuation multiples, compares them with historical and peer averages, and assesses the implications for investors navigating the heavy electrical equipment sector.
Read full news article Announcements
GE Power India Limited - Other General Purpose
03-Dec-2019 | Source : NSEGE Power India Limited has informed the Exchange regarding Disclosure of Related Party Transactions pursuant to Regulation 23(9) of the SEBI ( LODR) Regulations, 2015. (Listing Regulations)
GE Power India Limited - Updates
06-Nov-2019 | Source : NSEGE Power India Limited has informed the Exchange regarding 'Announcement under Regulation 30 (LODR)-Newspaper Publication'.
GE Power India Limited - Outcome of Board Meeting
05-Nov-2019 | Source : NSEGE Power India Limited has informed the Exchange regarding Board meeting held on November 04, 2019.
Corporate Actions

No Upcoming Board Meetings

GE Power India Ltd has declared 70% dividend, ex-date: 31 Jul 26

No Splits history available

No Bonus history available

No Rights history available
Quality key factors
Valuation key factors
Technicals key factors
 Technical Indicator Scale: Bearish, Mildly Bearish, Sideways, Mildly Bullish, Bullish Turned
 Shareholding Snapshot : Jun 2026
Shareholding Compare (%holding)
Promoters
None
Held by 2 Schemes (0.13%)
Held by 25 FIIs (1.16%)
Ge Steam Power International Bv (formerly Ge Power India Tracking Bv) (68.58%)
Aarti Bhatia (1.12%)
23.89%
Quarterly Results Snapshot (Consolidated) - Mar'26 - QoQ

QoQ Growth in quarter ended Mar 2026 is -17.95% vs 37.47% in Dec 2025
QoQ Growth in quarter ended Mar 2026 is 56.54% vs 123.49% in Dec 2025
Half Yearly Results Snapshot (Consolidated) - Sep'25

Growth in half year ended Sep 2025 is 22.33% vs -40.37% in Sep 2024
Growth in half year ended Sep 2025 is 16.99% vs 129.01% in Sep 2024
Nine Monthly Results Snapshot (Consolidated) - Dec'25
YoY Growth in nine months ended Dec 2025 is 22.07% vs -36.73% in Dec 2024
YoY Growth in nine months ended Dec 2025 is 259.65% vs 119.65% in Dec 2024
Annual Results Snapshot (Consolidated) - Mar'26
YoY Growth in year ended Mar 2026 is 21.23% vs 0.81% in Mar 2025
YoY Growth in year ended Mar 2026 is 24.44% vs 218.48% in Mar 2025
About GE Power India Ltd

Company Coordinates


