
Compare Glance Finance with Similar Stocks
Stock DNA
Non Banking Financial Company (NBFC)
INR 37 Cr (Micro Cap)
NA (Loss Making)
9
0.00%
0.02
-5.68%
0.74
Total Returns (Price + Dividend) 
Latest dividend: 0.7 per share ex-dividend date: Sep-21-2015
Risk Adjusted Returns v/s
Returns Beta

News
Are Glance Finance Ltd latest results good or bad?
Glance Finance Ltd's latest financial results for the quarter ended March 2026 indicate significant operational challenges. The company reported net sales of -₹0.34 crores, which represents a substantial decline of 112.10% compared to the previous quarter's sales of ₹2.81 crores. This negative revenue generation is highly unusual for a financial services company and raises concerns about the sustainability of its business model. The net profit for the same period was recorded at -₹3.84 crores, reflecting a staggering decline of 612.00% from a profit of ₹0.75 crores in the previous quarter. This marks the lowest level of profitability recorded in the available data, suggesting severe operational distress. The operating profit before depreciation, interest, and tax (PBDIT) also fell to -₹3.54 crores, the lowest on record, indicating a significant deterioration in core business performance. The company's pro...
Read full news article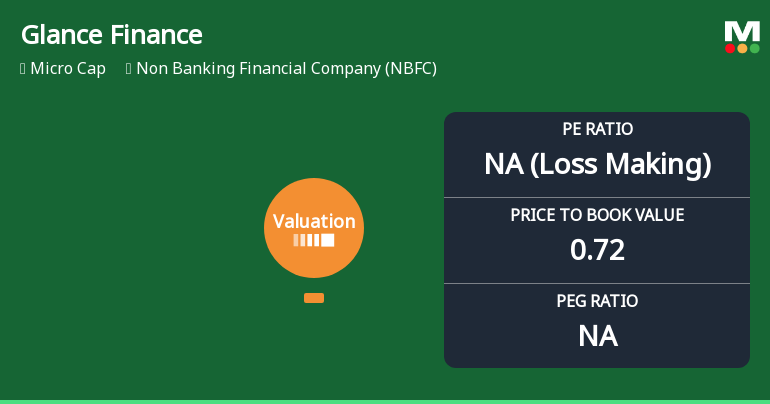
Glance Finance Ltd Valuation Shifts Signal Heightened Risk Amid Market Volatility
Glance Finance Ltd, a micro-cap player in the Non Banking Financial Company (NBFC) sector, has seen a marked deterioration in its valuation metrics, prompting a downgrade to a Strong Sell rating. The company’s price-to-earnings (P/E) ratio has plunged into negative territory, while its price-to-book value (P/BV) remains below unity, signalling heightened risk and diminished price attractiveness relative to its peers and historical benchmarks.
Read full news article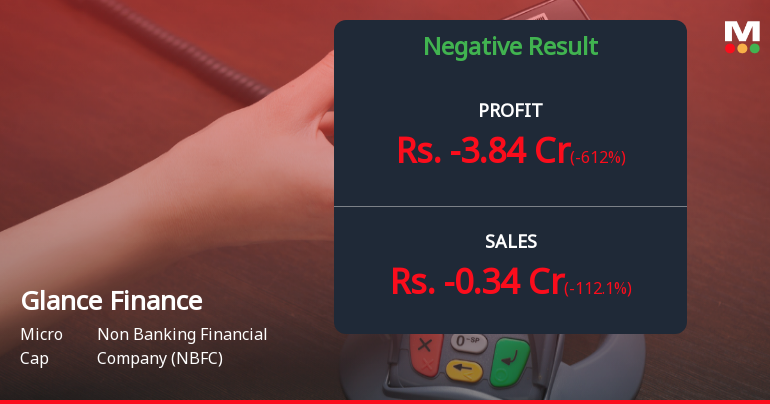
Glance Finance Q4 FY26: Heavy Losses Trigger Alarm as Operations Turn Negative
Glance Finance Ltd., a micro-cap non-banking financial company, reported a startling quarter-on-quarter deterioration in Q4 FY26, posting a net loss of ₹3.84 crores compared to a profit of ₹0.75 crores in Q3 FY26. The dramatic reversal represents a 612.00% decline sequentially and marks the company's worst quarterly performance in recent years, with negative sales of ₹0.34 crores raising fundamental questions about operational viability.
Read full news article Announcements
Announcement under Regulation 30 (LODR)-Acquisition
04-Jun-2026 | Source : BSEAs per attachment
Announcement under Regulation 30 (LODR)-Newspaper Publication
01-Jun-2026 | Source : BSENewspaper publication of extract of approval of audited financial results for the quarter and year ended 31.03.2026
Board Meeting Outcome for Outcome Of Board Meeting Held On 30.05.2026
30-May-2026 | Source : BSEConsidered and approved: 1. The Audited Financial Statements for the quarter and year ended 31st March 2026 along with Auditors Report. 2. Re-appointment of M/s. M. R. Sharma & Co. Chartered Accountants as an Internal Auditor of the Company for the financial year 2026-27.
Corporate Actions

No Upcoming Board Meetings

Glance Finance Ltd has declared 7% dividend, ex-date: 21 Sep 15

No Splits history available

No Bonus history available

No Rights history available
Quality key factors
Valuation key factors
Technicals key factors
 Technical Indicator Scale: Bearish, Mildly Bearish, Sideways, Mildly Bullish, Bullish Turned
 Shareholding Snapshot : Mar 2026
Shareholding Compare (%holding)
Promoters
None
Held by 0 Schemes
Held by 0 FIIs
Ashish Commercials Llp (24.69%)
Shree Ram Megaventures Llp (3.32%)
12.35%
Quarterly Results Snapshot (Standalone) - Mar'26 - QoQ

QoQ Growth in quarter ended Mar 2026 is -112.10% vs -64.70% in Dec 2025
QoQ Growth in quarter ended Mar 2026 is -612.00% vs 971.43% in Dec 2025
Half Yearly Results Snapshot (Standalone) - Sep'24

Growth in half year ended Sep 2024 is 296.59% vs 103.47% in Sep 2023
Growth in half year ended Sep 2024 is 102.13% vs 1,040.00% in Sep 2023
Nine Monthly Results Snapshot (Standalone) - Dec'24
YoY Growth in nine months ended Dec 2024 is 107.10% vs 269.42% in Dec 2023
YoY Growth in nine months ended Dec 2024 is 67.39% vs 330.00% in Dec 2023
Annual Results Snapshot (Standalone) - Mar'26
YoY Growth in year ended Mar 2026 is 17.21% vs 13.76% in Mar 2025
YoY Growth in year ended Mar 2026 is 112.07% vs 19.59% in Mar 2025
About Glance Finance Ltd

Company Coordinates


