
Compare Global Partners LP with Similar Stocks
Dashboard
1
Low ability to service debt as the company has a high Debt to EBITDA ratio of 4.09 times
- Low ability to service debt as the company has a high Debt to EBITDA ratio of 4.09 times
- The company has been able to generate a Return on Capital Employed (avg) of 12.05% signifying low profitability per unit of total capital (equity and debt)
2
Negative results in Jun 25
3
Below par performance in long term as well as near term
Total Returns (Price + Dividend) 
TimePeriod
Price Return
Dividend Return
Total Return
3 Months
-17.37%
0%
-17.37%
6 Months
-17.51%
0%
-17.51%
1 Year
-11.15%
0%
-11.15%
2 Years
43.16%
0%
43.16%
3 Years
62.1%
0%
62.1%
4 Years
64.01%
0%
64.01%
5 Years
298.92%
0%
298.92%
Global Partners LP for the last several years.
Risk Adjusted Returns v/s
News
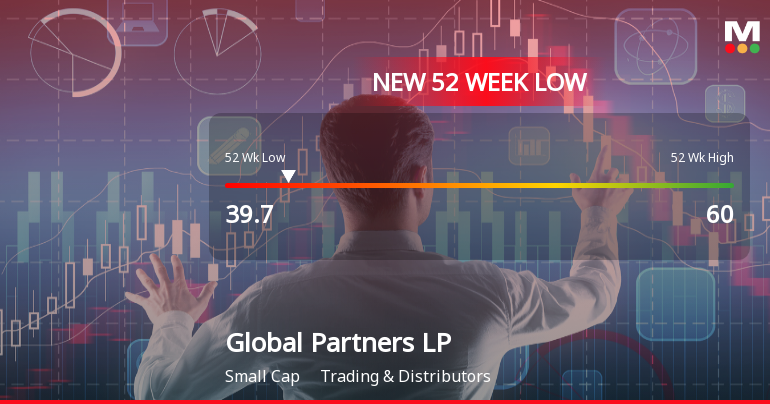
Global Partners LP Stock Plummets to New 52-Week Low at USD 39.70
Global Partners LP has hit a new 52-week low, trading at USD 39.70 as of November 7, 2025, following a 15.76% decline over the past year. The company faces challenges with high debt levels and low profitability, while its dividend yield remains at 0.00%.
Read full news article Announcements

No announcement available
Corporate Actions
No corporate action available
Quality key factors
Factor
Value
Sales Growth (5y)
10.83%
EBIT Growth (5y)
7.57%
EBIT to Interest (avg)
2.62
Debt to EBITDA (avg)
4.09
Net Debt to Equity (avg)
2.54
Sales to Capital Employed (avg)
8.11
Tax Ratio
3.91%
Dividend Payout Ratio
118.65%
Pledged Shares
0
Institutional Holding
50.95%
ROCE (avg)
12.05%
ROE (avg)
24.02%
Valuation key factors
Factor
Value
P/E Ratio
11
Industry P/E
Price to Book Value
2.63
EV to EBIT
11.82
EV to EBITDA
8.03
EV to Capital Employed
1.46
EV to Sales
0.20
PEG Ratio
0.29
Dividend Yield
NA
ROCE (Latest)
12.37%
ROE (Latest)
23.82%
Technicals key factors
Indicator
Weekly
Monthly
MACD
Mildly Bullish
Mildly Bearish
RSI
No Signal
No Signal
Bollinger Bands
Mildly Bearish
Mildly Bearish
Moving Averages
Mildly Bearish (Daily)
KST
Mildly Bullish
Mildly Bearish
Dow Theory
No Trend
Mildly Bearish
OBV
No Trend
No Trend
 Technical Indicator Scale: Bearish, Mildly Bearish, Sideways, Mildly Bullish, Bullish Turned
 Shareholding Snapshot : Mar 2025
Shareholding Compare (%holding)
Majority shareholders
Domestic Funds
Domestic Funds
Held in 17 Schemes (31.54%)
Foreign Institutions
Held by 8 Foreign Institutions (1.15%)
Strategic Entities with highest holding
Highest Public shareholder
Quarterly Results Snapshot (Consolidated) - Jun'25 - QoQ
Jun'25
Mar'25
Change(%)
Net Sales
4,626.90
4,592.20
0.76%
Operating Profit (PBDIT) excl Other Income
94.50
105.00
-10.00%
Interest
34.50
36.00
-4.17%
Exceptional Items
-0.80
-15.70
94.90%
Consolidate Net Profit
25.20
18.70
34.76%
Operating Profit Margin (Excl OI)
12.60%
15.00%
-0.24%
USD in Million.

Net Sales
QoQ Growth in quarter ended Jun 2025 is 0.76% vs 9.70% in Mar 2025

Consolidated Net Profit
QoQ Growth in quarter ended Jun 2025 is 34.76% vs -21.76% in Mar 2025
Annual Results Snapshot (Consolidated) - Dec'24
Dec'24
Dec'23
Change(%)
Net Sales
17,163.60
16,492.20
4.07%
Operating Profit (PBDIT) excl Other Income
399.80
357.60
11.80%
Interest
134.80
85.60
57.48%
Exceptional Items
-18.40
-6.40
-187.50%
Consolidate Net Profit
110.30
152.50
-27.67%
Operating Profit Margin (Excl OI)
15.20%
15.00%
0.02%
USD in Million.
Net Sales
YoY Growth in year ended Dec 2024 is 4.07% vs -12.64% in Dec 2023
Consolidated Net Profit
YoY Growth in year ended Dec 2024 is -27.67% vs -57.90% in Dec 2023
About Global Partners LP

Global Partners LP
Trading & Distributors
No Details Available.
Company Coordinates
No Company Details Available
InfinHub Market Technologies FZ-LLC, Building-2, Unit 112, Dubai Internet City, Dubai, United Arab Emirates
GET THE MARKETSMOJO APP


Company
Stocks
Portfolio


"Investment in securities markets are subject to market risk. Read all the related documents carefully before investing."